

miR-106a represses the Rb tumor suppressor p130 to regulate cellular proliferation and differentiation in high-grade serous ovarian carcinoma
- PMID: 24045973
- PMCID: PMC3911890
- DOI: 10.1158/1541-7786.MCR-13-0131
miR-106a represses the Rb tumor suppressor p130 to regulate cellular proliferation and differentiation in high-grade serous ovarian carcinoma
Abstract
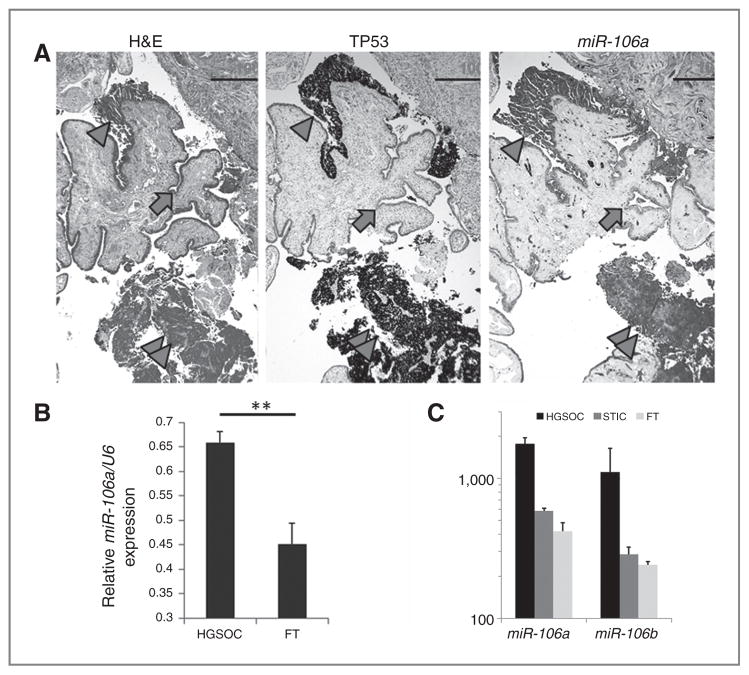
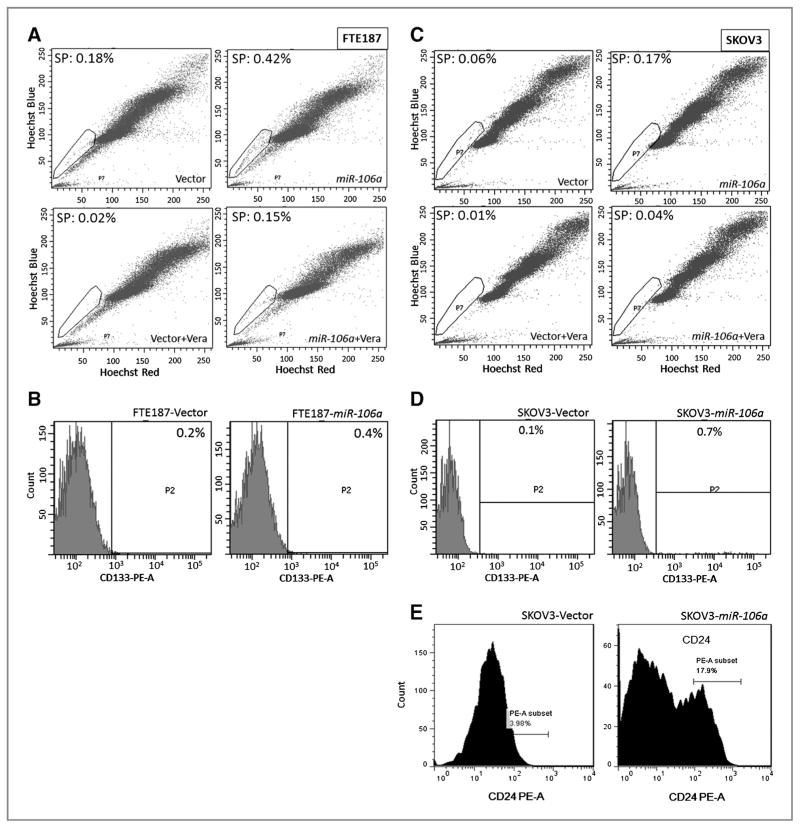
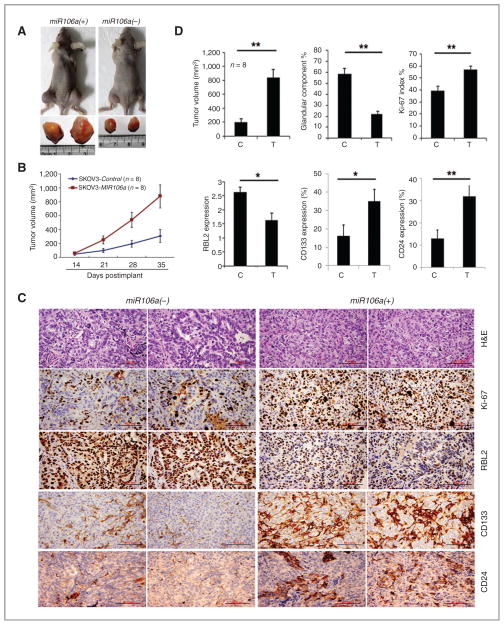
The degree of differentiation in human cancers generally reflects the degree of malignancy, with the most undifferentiated cancer being also the highest grade and the most aggressive. High-grade serous ovarian carcinomas (HGSOC) are poorly differentiated and fast-growing malignancies. The molecular mechanisms underlying the poor differentiation of HGSOC has not been completely characterized. Evidence suggests that miRNA, miR are dysregulated in HGSOC. Therefore, we focused on those miRNAs that are relevant to tumor differentiation. Expression profiling of miRNAs in HGSOC, indicated miR-106a and its family members were significantly upregulated. Upregulation of miR-106a was further validated by real-time reverse transcriptase PCR (qRT-PCR) and miRNA in situ hybridization in a large cohort of HGSOC specimens. Overexpression of miR-106a in benign and malignant ovarian cells significantly increased the cellular proliferation rate and expanded the side-population fraction. In particular, SKOV3 cells with miR-106a overexpression had significantly higher tumor initial/stem cell population (CD24- and CD133-positive cells) than control SKOV3 cells. Among many miR-106a predicated target genes, p130 (RBL2), an retinoblastoma (Rb) tumor suppressor family member, was not only confirmed as a specific target of miR-106a but also related to tumor growth and differentiation. The importance of mir-106a and RBL2 was further demonstrated in vivo, in which, SKOV3 cells overexpressing miR-106a formed poorly differentiated carcinomas and had reduced RBL2 levels. To our knowledge, this is the first study of miR-106a mediating proliferation and tumor differentiation in HGSOC.
Implications: The current study suggests that the RB tumor suppressor pathway is a critical regulator of growth and differentiation in HGSOC.
©2013 AACR.
Conflict of interest statement
No potential conflicts of interest were disclosed.
Figures


Similar articles
-
miR-145 inhibits tumor growth and metastasis by targeting metadherin in high-grade serous ovarian carcinoma.Oncotarget. 2014 Nov 15;5(21):10816-29. doi: 10.18632/oncotarget.2522. Oncotarget. 2014. PMID: 25333261 Free PMC article.
-
Characterization of MicroRNA-200 pathway in ovarian cancer and serous intraepithelial carcinoma of fallopian tube.BMC Cancer. 2017 Jun 17;17(1):422. doi: 10.1186/s12885-017-3417-z. BMC Cancer. 2017. PMID: 28623900 Free PMC article.
-
ROR2 induces cell apoptosis via activating IRE1α/JNK/CHOP pathway in high-grade serous ovarian carcinoma in vitro and in vivo.J Transl Med. 2019 Dec 26;17(1):428. doi: 10.1186/s12967-019-02178-x. J Transl Med. 2019. PMID: 31878941 Free PMC article.
-
HMGA2 and high-grade serous ovarian carcinoma.J Mol Med (Berl). 2013 Oct;91(10):1155-65. doi: 10.1007/s00109-013-1055-8. Epub 2013 May 19. J Mol Med (Berl). 2013. PMID: 23686260 Review.
-
High-grade serous ovarian carcinoma, the "Achiles' hill" for clinicians and molecular biologists: a molecular insight.Mol Biol Rep. 2023 Nov;50(11):9511-9519. doi: 10.1007/s11033-023-08760-3. Epub 2023 Sep 22. Mol Biol Rep. 2023. PMID: 37737967 Review.
Cited by
-
CCAT1: a pivotal oncogenic long non-coding RNA in human cancers.Cell Prolif. 2016 Jun;49(3):255-60. doi: 10.1111/cpr.12252. Epub 2016 May 1. Cell Prolif. 2016. PMID: 27134049 Free PMC article. Review.
-
Peri-foci adipose-derived stem cells promote chemoresistance in breast cancer.Stem Cell Res Ther. 2017 Jul 27;8(1):177. doi: 10.1186/s13287-017-0630-2. Stem Cell Res Ther. 2017. PMID: 28750689 Free PMC article.
-
Anti-proliferative activity and cell cycle arrest induced by evodiamine on paclitaxel-sensitive and -resistant human ovarian cancer cells.Sci Rep. 2015 Nov 10;5:16415. doi: 10.1038/srep16415. Sci Rep. 2015. PMID: 26553648 Free PMC article.
-
Roles of Dietary Phytoestrogens on the Regulation of Epithelial-Mesenchymal Transition in Diverse Cancer Metastasis.Toxins (Basel). 2016 May 24;8(6):162. doi: 10.3390/toxins8060162. Toxins (Basel). 2016. PMID: 27231938 Free PMC article. Review.
-
miRNA-106a and prostate cancer radioresistance: a novel role for LITAF in ATM regulation.Mol Oncol. 2018 Aug;12(8):1324-1341. doi: 10.1002/1878-0261.12328. Epub 2018 Jun 14. Mol Oncol. 2018. PMID: 29845714 Free PMC article.
References
Publication types
MeSH terms
Substances
Grants and funding
LinkOut - more resources
Full Text Sources
Other Literature Sources
Medical
Research Materials
