. 2013 Oct 31;122(18):3230-7.
doi: 10.1182/blood-2013-04-495515. Epub 2013 Sep 17.

Effector T cells require fatty acid metabolism during murine graft-versus-host disease

Affiliations

Effector T cells require fatty acid metabolism during murine graft-versus-host disease

Craig A Byersdorfer et al. Blood. .

Abstract

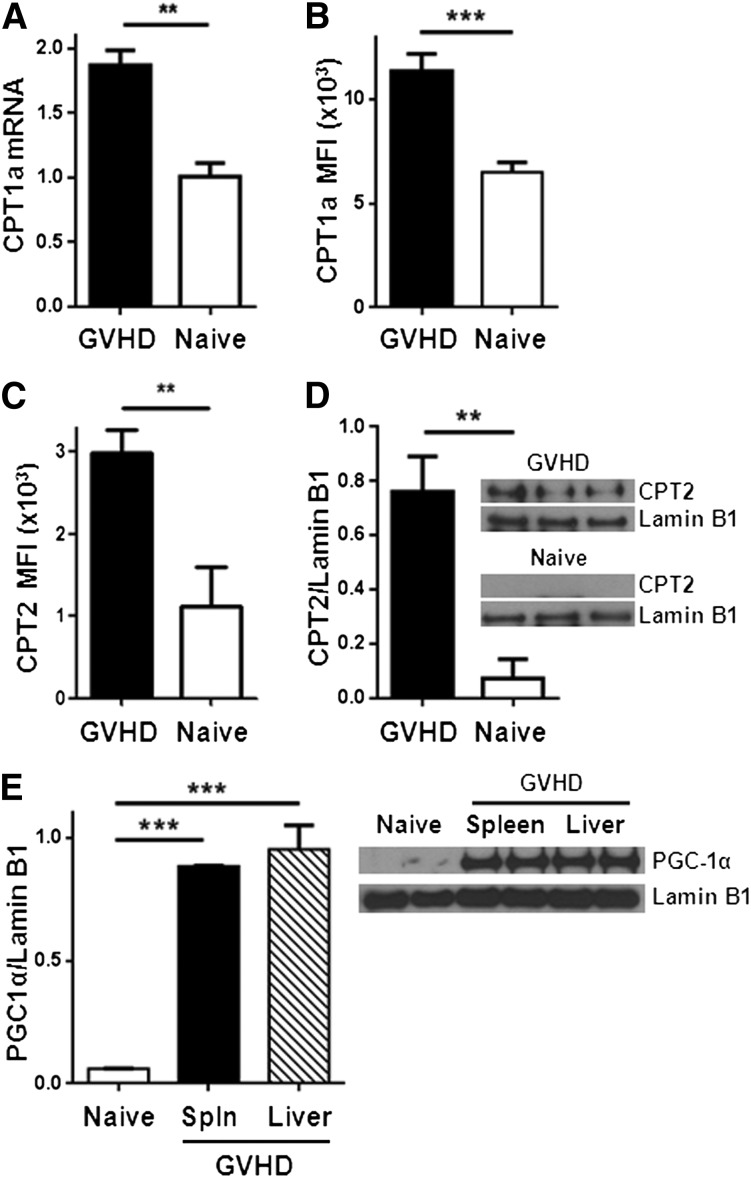
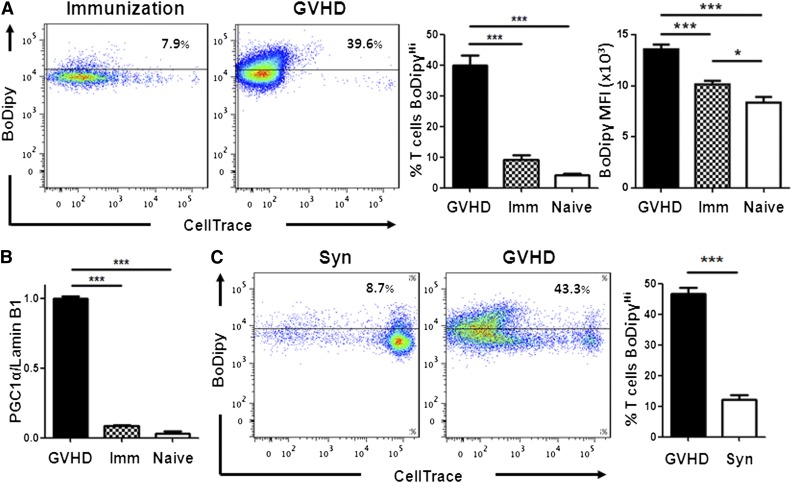
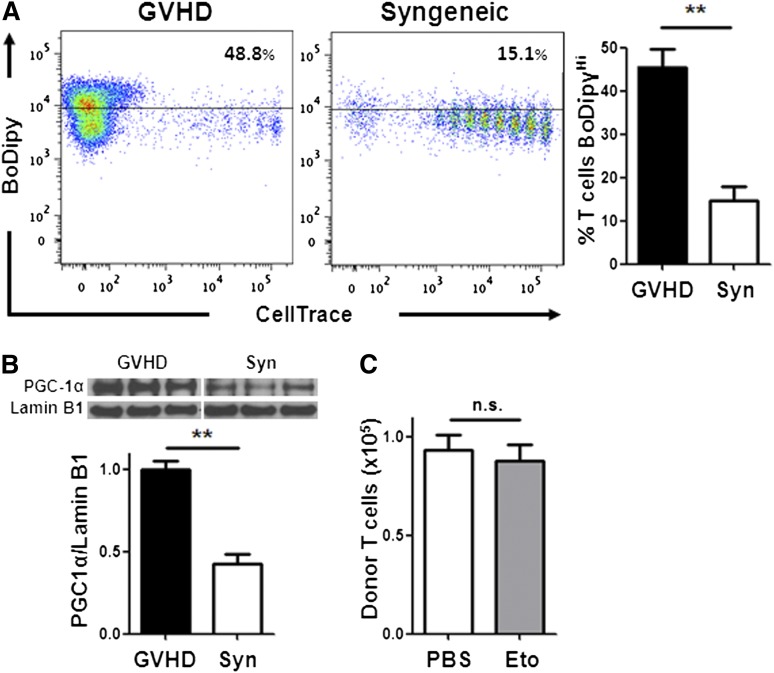
Activated T cells require increased energy to proliferate and mediate effector functions, but the metabolic changes that occur in T cells following stimulation in vivo are poorly understood, particularly in the context of inflammation. We have previously shown that T cells activated during graft-versus-host disease (GVHD) primarily rely on oxidative phosphorylation to synthesize adenosine 5'-triphosphate. Here, we demonstrate that alloreactive effector T cells (Teff) use fatty acids (FAs) as a fuel source to support their in vivo activation. Alloreactive T cells increased FA transport, elevated levels of FA oxidation enzymes, up-regulated transcriptional coactivators to drive oxidative metabolism, and increased their rates of FA oxidation. Importantly, increases in FA transport and up-regulation of FA oxidation machinery occurred specifically in T cells during GVHD and were not seen in Teff following acute activation. Pharmacological blockade of FA oxidation decreased the survival of alloreactive T cells but did not influence the survival of T cells during normal immune reconstitution. These studies suggest that pathways controlling FA metabolism might serve as therapeutic targets to treat GVHD and other T-cell-mediated immune diseases.


Figures

Figure 1
Figure 1
Allogeneic T cells increase FA transport during GVHD. (A) B6 Ly5.2 (CD45.1+) donor T cells were loaded with CellTrace violet and transferred to irradiated B6D2F1 mice as described in “Methods.” Cells were recovered 1, 3, or 7 days after transplantation, stained for CD45.1 and TCR-β, and assessed for BoDipyC1-C12 uptake. Unmanipulated donor cells (not labeled with CellTrace) from “naïve” mice served as controls. Plots are gated on CD45.1+, TCR-β+ cells. (B) The percentage of BoDipyHi donor T cells (n ≥ 3/group). (C) Cells were preincubated with or without palmitate followed by measurement of BoDipyC1-C12 uptake as described in “Methods.” (D) Cells were processed as in A, then stained with Vibrant Dye Ruby, and the percentage of cells in G2/S/M phase from either BoDipyLo (lower 2 quartiles) or BoDipyHi (upper quartile) populations (n = 6 mice/group) was measured. (E) Donor T cells 7 days after BMT were assessed for IFN-γ production, followed by BoDipyC1-C12 uptake. **P < .004, ***P < .0001; n.s., not significant.
Figure 2
Figure 2
Allogeneic T cells up-regulate CPT1a, CPT2, and PGC1-α during GVHD. (A) Donor T cells were flow-sorted from either naïve donor animals or allogeneic recipients 7 days after BMT (GVHD) and levels of CPT1a quantitated by RT-PCR. (B) Median fluorescence intensity (MFI) of CPT1a in T cells following intracellular staining as described in Methods. Data represent 4 to 6 mice/group. (C) Intracellular CPT2 was measured by flow cytometry (supplemental Figure 4) and the results quantitated (n = 4/group). (D) Donor T cells (CD45.1+, TCR-β+, Annexin) were flow-sorted and cell lysates probed for CPT2 by western blot. Shown is 1 of 3 independent experiments. (E) T-cell lysates from spleen or liver were purified by flow-sorting and probed by western blot for levels of PGC1-α. Each lysate was pooled from ≥3 mice. **P < .006, ***P < .0001.
Figure 3
Figure 3
Day 7 allogeneic T cells increase FA oxidation ex vivo and in vivo. (A) T cells were purified by magnetic separation from naïve donors or day 7 allogeneic recipients (GVHD), incubated with 3H-palmitate for 6 hours (unstimulated), and supernatants assayed for production of 3H2O as detailed in Methods. Analysis was performed in triplicate with pooled samples and represent >3 independent experiments. Stimulated samples were incubated with 3H-palmitate for 16 hours on anti-CD3, anti-CD28–coated plates. (B) Glutamate labeled in the 4,5 position with 13C (M2 glutamate) was compared with total 13C-labeled glutamate as described in Methods. *P = .02, ***P < .005.
Figure 4
Figure 4
Allogeneic T cells from a minor histocompatibility model increase FA transport and up-regulate CPT2 and PGC1-α (A) 3 × 10⁶ B6 Ly5.2 (CD45.1+) T cells were transplanted into irradiated C3H.SW as detailed in “Methods.” BoDipyC1-C12 uptake was measured as in Figure 1, with allogeneic T cells shown in solid black line and naïve in shaded gray. The percentage of BoDipyHi cells and the MFI of BoDipy was further quantitated (n = 9 GVHD, n = 3 naïve) and represent 2 independent experiments. (B) 105 T cells from naïve donors or minor histocompatibility allogeneic recipients (GVHD) were purified by flow-sorting and cell lysates probed for CPT2 by western blotting as in Figure 2. (C) PGC-1α levels in naïve donor or day 7 allogeneic T cells. Lamin B1 served as a loading control. n = 3 mice per lane. **P < .004, ***P < .0005.
Figure 5
Figure 5
Teff increase FA metabolism during GVHD but not following cellular immunization. (A) FA transport was measured in OT-I cells from naïve donors or in OT-I cells 7 days after either CAG.OVA dendritic cell immunization (Imm) or transplantation into irradiated CAG.OVA mice (GVHD), n = 4 mice/bar. (B) OT-I T cell lysates (following flow-sorting) were probed for PGC-1α levels by western blot as in Figure 2E. (C) B6 Ly5.2 (CD45.1+) splenocytes were labeled with CellTrace violet and transferred to nonirradiated B6D2F1 animals (GVHD) as described in “Methods.” On day 7, donor T cells were recovered and measured for BoDipyC1-C12 uptake. B6 Ly5.2 T cells transferred to nonirradiated C57Bl/6 animals served as controls (Syn). Bar graphs represent 4 to 5 mice/group. ***P < .007.
Figure 6
Figure 6
Blockade of FA oxidation preferentially targets well-divided, allogeneic T cells. (A) T cells were purified by magnetic separation and cultured ex vivo with B6D2F1 splenocytes with or without etomoxir as detailed in Methods. (B) Mice received a single dose of etomoxir on day 7 and total donor T-cell numbers were measured 16 hours later. (C) AnnexinV staining of donor T cells 16 hours after etomoxir treatment. (D) C57Bl/6 recipient mice were transplanted with BM and T cells from C3H.SW donor mice as detailed in “Methods.” Beginning on day +5, recipient mice received either PBS (black circles) or etomoxir (gray triangles) every other day for a total of 2 weeks. Clinical scores, as described previously, were measured on day 29, 10 days after the discontinuation of etomoxir. The mean clinical score is represented by a solid black line. *P = .02, **P < .01.
Figure 7
Figure 7
Homeostatic T-cell proliferation does not require FA metabolism. (A) BoDipy uptake was measured in B6 Ly5.2 donor T cells from either allogeneic (GVHD) or syngeneic (Syn) recipients as in Figure 1A. n = 3 mice/group and represent 3 independent experiments. Plots are gated on CD45.1+, TCR-β+ cells. (B) Donor T cells from allogeneic (GVHD) or syngeneic recipients were purified by flow-sorting 7 days after BMT and cell lysates probed via western blotting for PGC-1α as in Figure 2. (C) Syngeneic recipients were given a single intraperitoneal dose of PBS (white) or etomoxir (gray) 7 days post-BMT and the number of donor T cells measured 16 hours later (compare with Figure 6B). n = 8 mice/group, 1 of 2 independent experiments shown. **P < .005, n.s., not significant.

References

    1. Badovinac VP, Haring JS, Harty JT. Initial T cell receptor transgenic cell precursor frequency dictates critical aspects of the CD8(+) T cell response to infection. Immunity. 2007;26(6):827–841. - PMC - PubMed
    1. Yoon H, Kim TS, Braciale TJ. The cell cycle time of CD8+ T cells responding in vivo is controlled by the type of antigenic stimulus. PLoS ONE. 2010;5(11):e15423. - PMC - PubMed
    1. Kaech SM, Cui W. Transcriptional control of effector and memory CD8+ T cell differentiation. Nat Rev Immunol. 2012;12(11):749–761. - PMC - PubMed
    1. Zhang N, Bevan MJ. CD8(+) T cells: foot soldiers of the immune system. Immunity. 2011;35(2):161–168. - PMC - PubMed
    1. Lanzavecchia A, Sallusto F. Progressive differentiation and selection of the fittest in the immune response. Nat Rev Immunol. 2002;2(12):982–987. - PubMed

Publication types

MeSH terms