. 2013 Sep 5:7:402.
doi: 10.3389/fnhum.2013.00402. eCollection 2013.

Graph theory reveals dysconnected hubs in 22q11DS and altered nodal efficiency in patients with hallucinations

Affiliations

Graph theory reveals dysconnected hubs in 22q11DS and altered nodal efficiency in patients with hallucinations

Marie-Christine Ottet et al. Front Hum Neurosci. .

Abstract

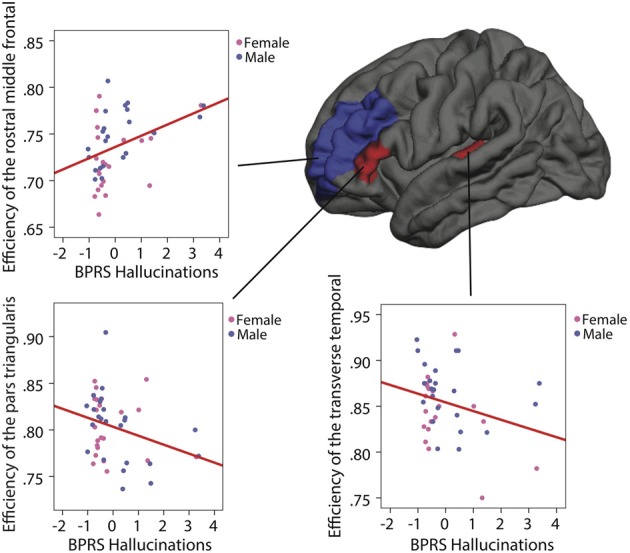
Schizophrenia is postulated to be the prototypical dysconnection disorder, in which hallucinations are the core symptom. Due to high heterogeneity in methodology across studies and the clinical phenotype, it remains unclear whether the structural brain dysconnection is global or focal and if clinical symptoms result from this dysconnection. In the present work, we attempt to clarify this issue by studying a population considered as a homogeneous genetic sub-type of schizophrenia, namely the 22q11.2 deletion syndrome (22q11.2DS). Cerebral MRIs were acquired for 46 patients and 48 age and gender matched controls (aged 6-26, respectively mean age = 15.20 ± 4.53 and 15.28 ± 4.35 years old). Using the Connectome mapper pipeline (connectomics.org) that combines structural and diffusion MRI, we created a whole brain network for each individual. Graph theory was used to quantify the global and local properties of the brain network organization for each participant. A global degree loss of 6% was found in patients' networks along with an increased Characteristic Path Length. After identifying and comparing hubs, a significant loss of degree in patients' hubs was found in 58% of the hubs. Based on Allen's brain network model for hallucinations, we explored the association between local efficiency and symptom severity. Negative correlations were found in the Broca's area (p < 0.004), the Wernicke area (p < 0.023) and a positive correlation was found in the dorsolateral prefrontal cortex (DLPFC) (p < 0.014). In line with the dysconnection findings in schizophrenia, our results provide preliminary evidence for a targeted alteration in the brain network hubs' organization in individuals with a genetic risk for schizophrenia. The study of specific disorganization in language, speech and thought regulation networks sharing similar network properties may help to understand their role in the hallucination mechanism.

Keywords: Broca; DTI; Wernicke; human connectome; network; psychosis; schizophrenia; small-world.


Figures

Figure 1
Figure 1
Among the Desikan parcellation scheme, the regions elected as similar to Allen's model areas are the represented in full color and the remainder parcels are in faded color. On the lateral view: the superior temporal is cyan, the rostral middle frontal is purple, the lateral orbitofrontal is dark green, the pars orbitalis is khaki, the pars triangularis is dark orange, and the pars opercularis is beige. On the medial view, the medial orbitofrontal is fuchsia, the rostral anterior cingulate is dark purple, and the caudal cingulate is parme.
Figure 2
Figure 2
Final ranking of the 82 gray matter regions in the healthy controls' brain. The 17 nodes with the highest rank highlighted in yellow, are considered as the connector hubs of the network. In blue is represented the repartition of the final ranking for the control and in red for the 22q11.2DS.
Figure 3
Figure 3
Graph representation of the mean brain network for patients and controls using Gephi (http://gephi.org/) to produce optimal visualization of all the nodes and connections embedded in the networks. The circled nodes are the hubs of the network. The red circles are altered hubs and the black circles are preserved hubs. Every nodes contained in the same lobe or cerebral structure has the same color, blue for the node of the frontal lobe, magenta for the cingulate areas, green for the parietal lobe, yellow for the occipital lobe, brown for the temporal lobe and gray for the subcortical areas. The size of the nodes indicates their degree level.
Figure 4
Figure 4
Correlations between the BPRS hallucination subscale and the network efficiency in individuals with 22q11.2DS after age and gender correction. On the left hemisphere, the red regions (pars triangularis and transverse temporal) represent a negative correlation and the blue region (rostral middle frontal) represents a positive correlation.

References

    1. Alexander-Bloch A., Giedd J. N., Bullmore E. (2013). Imaging structural co-variance between human brain regions. Nat. Rev. Neurosci. 14, 322–336 10.1038/nrn3465 - DOI - PMC - PubMed
    1. Allen P., Larøi F., McGuire P. K., Aleman A. (2008). The hallucinating brain: a review of structural and functional neuroimaging studies of hallucinations. Neurosci. Biobehav. Rev. 32, 175–191 10.1016/j.neubiorev.2007.07.012 - DOI - PubMed
    1. Arnsten A. F. T., Wang M. J., Paspalas C. D. (2012). Neuromodulation of thought: flexibilities and vulnerabilities in prefrontal cortical network synapses. Neuron 76, 223–239 10.1016/j.neuron.2012.08.038 - DOI - PMC - PubMed
    1. Bammer R., Acar B., Moseley M. E. (2003). In vivo MR tractography using diffusion imaging. Eur. J. Radiol. 45, 223–234 10.1016/S0720-048X(02)00311-X - DOI - PubMed
    1. Bassett A. S., Chow E. W. (1999). 22q11 deletion syndrome: a genetic subtype of schizophrenia. Biol. Psychiatry 46, 882–891 10.1016/S0006-3223(99)00114-6 - DOI - PMC - PubMed

LinkOut - more resources