

Constant drug dose in human immuno-deficiency virus-infected patients to induce long-term non-progressor status: bifurcation and controllability approach
- PMID: 24046977
- PMCID: PMC8687248
- DOI: 10.1049/iet-syb.2012.0006
Constant drug dose in human immuno-deficiency virus-infected patients to induce long-term non-progressor status: bifurcation and controllability approach
Abstract
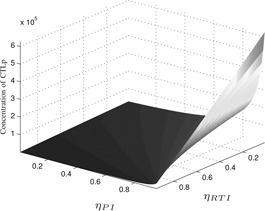
The authors propose a therapy consisting of a constant dosage of reverse transcription inhibitor and protease inhibitor to achieve long-term non-progressor (LTNP) status in human immuno-deficiency virus (HIV) patients. Based on the authors analyses of cytotoxic T lymphocyte precursor (CTLp) concentration at several equilibrium points and the bifurcation of these equilibrium points, they find that administration of drugs with an efficacy lower than a certain level induces a higher CTLp concentration. As a result, drug doses of moderate efficacy result in more patients with LTNP status than doses with high efficacy. In analyses of controllability, they show that a treatment of moderate efficacy is more efficient than one of very high efficacy in terms of controlling the immune system. Using simulations, they demonstrate that their proposed method results in LTNP status in HIV patients.
Figures


Similar articles
-
Low expression of inhibitory natural killer receptors in CD8 cytotoxic T lymphocytes in long-term non-progressor HIV-1-infected patients.AIDS. 2003 Jan 24;17(2):257-60. doi: 10.1097/00002030-200301240-00017. AIDS. 2003. PMID: 12545087
-
Reduced Natural Killer Cell Subsets in Perinatally Acquired Long-Term Non-Progressor Human Immunodeficiency Virus-Infected Children.AIDS Res Hum Retroviruses. 2019 May;35(5):437-443. doi: 10.1089/AID.2018.0243. Epub 2019 Feb 27. AIDS Res Hum Retroviruses. 2019. PMID: 30632379
-
Mechanisms of HIV non-progression; robust and sustained CD4+ T-cell proliferative responses to p24 antigen correlate with control of viraemia and lack of disease progression after long-term transfusion-acquired HIV-1 infection.Retrovirology. 2008 Dec 11;5:112. doi: 10.1186/1742-4690-5-112. Retrovirology. 2008. PMID: 19077215 Free PMC article.
-
[Current status and future issues of anti-HIV chemotherapy].Uirusu. 2003 Dec;53(2):141-6. doi: 10.2222/jsv.53.141. Uirusu. 2003. PMID: 15071952 Review. Japanese. No abstract available.
-
Nelfinavir: an update on its use in HIV infection.Drugs. 2000 Mar;59(3):581-620. doi: 10.2165/00003495-200059030-00014. Drugs. 2000. PMID: 10776836 Review.
Cited by
-
Efficient prediction of drug-drug interaction using deep learning models.IET Syst Biol. 2020 Aug;14(4):211-216. doi: 10.1049/iet-syb.2019.0116. IET Syst Biol. 2020. PMID: 32737279 Free PMC article.
References
-
- Janeway C.A. Travers P. Walport M., and Shlomchik M.: ‘Immunobiology’ (Garland Science Publishing, New York, 2004)
-
- Perelson A., and Nelson P.: ‘Mathematical analysis of HIV‐1 dynamics in vivo’, SIAM Rev., 1999, 41, pp. 3–44 (doi: 10.1137/S0036144598335107) - DOI
MeSH terms
Substances
LinkOut - more resources
Full Text Sources
Other Literature Sources
Medical
Research Materials
