. 2015 Mar;25(3):631-45.
doi: 10.1093/cercor/bht254. Epub 2013 Sep 18.

The early fetal development of human neocortical GABAergic interneurons

Affiliations

The early fetal development of human neocortical GABAergic interneurons

Nahidh Al-Jaberi et al. Cereb Cortex. 2015 Mar.

Abstract

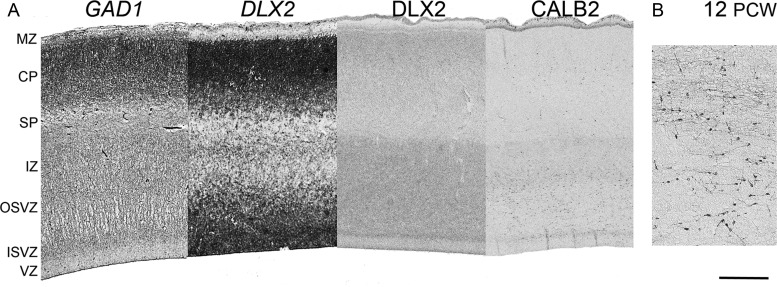
GABAergic interneurons are crucial to controlling the excitability and responsiveness of cortical circuitry. Their developmental origin may differ between rodents and human. We have demonstrated the expression of 12 GABAergic interneuron-associated genes in samples from human neocortex by quantitative rtPCR from 8 to 12 postconceptional weeks (PCW) and shown a significant anterior to posterior expression gradient, confirmed by in situ hybridization or immunohistochemistry for GAD1 and 2, DLX1, 2, and 5, ASCL1, OLIG2, and CALB2. Following cortical plate (CP) formation from 8 to 9 PCW, a proportion of cells were strongly stained for all these markers in the CP and presubplate. ASCL1 and DLX2 maintained high expression in the proliferative zones and showed extensive immunofluorescent double-labeling with the cell division marker Ki-67. CALB2-positive cells increased steadily in the SVZ/VZ from 10 PCW but were not double-labeled with Ki-67. Expression of GABAergic genes was generally higher in the dorsal pallium than in the ganglionic eminences, with lower expression in the intervening ventral pallium. It is widely accepted that the cortical proliferative zones may generate CALB2-positive interneurons from mid-gestation; we now show that the anterior neocortical proliferative layers especially may be a rich source of interneurons in the early neocortex.

Keywords: DLX genes; GABA; GABRB3; cerebral cortex; inhibitory interneurons; neurodevelopmental disorders.


Figures

Figure 1.
Figure 1.
qPCR confirmation of gradients of GABAergic gene expression between 8 and 12 PCW, and comparison with microarray and RNA seq data from previous studies. The mean expression of the genes of interest, relative to the average expression of 3 reference genes, β-ACTIN, GAPDH, and SDHA, from RNA samples taken from the anterior and posterior poles of the human neocortex between 8 and 12 PCW, is shown for qPCR data collected in the present study (A, n = 8 fetuses) Affymetrix microarray (B, n = 6, Ip et al. 2010) and RNA seq (C, n = 4, http://brainspan.org/rnaseq/search/index.html). The general patterns of expression are the same for all 3 studies, although the qPCR study shows less experimental variability and thus detected differences between the anterior and posterior poles with greater confidence. Clear evidence is provided for higher anterior expression of all GABAergic genes at this time. FGFR3 expression is included as an example of a posteriorly expressed gene. **P < 0.01, *P < 0.05, error bars represent 95% confidence limits. Note that the chart is plotted on a logarithmic scale resulting in asymmetric error bars.
Figure 2.
Figure 2.
Temporal changes in GABAergic gene expression by qPCR between 8 and 12 PCW. The expression of the genes of interest, relative to the average expression of 3 reference genes, from RNA samples taken from the anterior and posterior poles of the human neocortex between 8 and 12 PCW, is shown for qPCR data collected in the present study (n = 8 fetuses). Statistically significant linear correlations of expression over time (P < 0.05) are marked with a line. It can be seen that nearly all genes showed increased expression, both anteriorly and posteriorly, with age, although for some genes, notably DLX5 and GABRB3, expression increased more quickly anteriorly, compared with posteriorly. FGFR3 expression is included as an example of a posteriorly expressed gene.
Figure 3.
Figure 3.
Expression gradients for GABAergic genes shown by in situ hybridization. Examples of DLX expression are shown in lateral sagittal sections at 8 PCW (A,B). There was moderate expression in the lateral ganglionic eminence (LGE) but weakest expression at the boundaries between ventral pallium (VP) and LGE before moderate expression resumes in the VZ and SVZ, and strong expression was observed in the cortical plate (CP) of the VP and dorsal pallium (DP). A gradient of expression from anterior (Ant) to posterior (Pos) poles of the cortex was also discernible. GAD1 expression was shown at 9 PCW in a medial section (C). In subcortical structures, expression was relatively strong in the lateral and medial (MGE) ganglionic eminences, and in the thalamus (Th) but weak in the prethalamus (PrTh). There was less expression at the boundary of the LGE with the cortex (ventral pallium, VP) but relatively high expression in the anterior cortical wall compared with the posterior. Higher magnification images show GAD1 expression throughout the anterior cortical wall but highest in the SVZ and CP where many, but not all, cells appear stained. In the early subplate and intermediate zone (SP/IZ), an area of low cellular density, heavily stained cells are discernible, while in the VZ only a few moderately stained cells can be seen. In the posterior cortical wall, the pattern was similar although staining was less intense. Scale bar represents 100 μm in high-magnification images and 800 μm at low magnification. The orientation of all the section images are the same, hence Ant and Pos are the same as indicated in A.
Figure 4.
Figure 4.
Expression gradients for immunoreactivity to GABAergic markers confirmed by optical densitometry. IHC for four proteins was selected for measurement at multiple ages; DLX2 (A), ASCL1 (B), GAD2 (C), and CALB2 (D). Low power images of immunostaining for each protein are shown, all at 9 PCW in medial sagittal sections. DLX2, ASCL1, and GAD2 all show moderate immunoreactivity in the medial ganglionic eminence but stronger expression in the neocortex, especially in the cortical plate (CP) but also in the ventricular and subventricular zone (VZ/SVZ) and a gradient of expression from the anterior to posterior pole of the neocortex. CALB2 also shows a gradient of expression, but differs from the other 3 in showing moderate expression in fibers in the subplate and intermediate zone (SP/IZ) but low expression in VZ/SVZ and the MGE. The ratio of anterior to posterior labeling density was calculated for each section and the mean plotted. Error bars represent 95% confidence limits of the mean, which are sometimes close enough together to be obscured by the representative symbol. With the exception of DLX2 expression at 8 PCW, there was consistently higher expression anteriorly for all genes and time point studied. The prethalamus (PrTh) and thalamus (Th) show low immunoreactivity for all four markers, with the exception of CALB2 expression in the thalamus. Scale bar = 2 mm. The orientation of all the section images is the same, hence Ant and Pos are the same as indicated in A.
Figure 5.
Figure 5.
Expression of GABAergic genes in horizontal sections at 8 PCW. Staining patterns for ISH for DLX5 (A), and IHC for CALB2 (B) in horizontal sections at 8 PCWs serve to further illustrate that there were 2 centers of strongest expression, in the ganglionic eminence, and in the dorsal pallium, particularly at more anterior (Ant) locations, with no evidence of a gradient of expression between the sub pallium and dorsal pallium that would suggest a migratory stream of cells moving between the 2. Indeed, there appeared to be distinct break in DLX5 expression between the postmitotic layers of the ganglionic eminence (GE) and cortical plate of the ventral pallium (arrow). However, at higher magnification, a few CALB2-positive neurons appeared to be crossing this zone (C, small arrows). Scale bar = 100 μm in A,B; 300 μm in C. The orientation of all the section images are the same, hence Ant is the same in B indicated in A (C is image of section in B at higher magnification).
Figure 6.
Figure 6.
Expression of GABAergic genes prior to cortical plate formation. Immunoreactivity for ASCL1 (A) GAD2 (B) and DLX2 (C) a little later was detectable both in cells of the proliferative ventricular zone (VZ) and postmitotic preplate (PP) confirming GABAergic neurons are born in the cortex at this early stage. Arrows point to radially orientated aggregates of cells expressing GAD2 and DLX2 suggesting these cells were being born in the ventricular zone and migrating radially. Low power images confirm that both OLIG2 (D, coronal section) and GAD2 (E, sagittal section) were as strongly expressed in the anterior/dorsal regions of the dorsal pallium as in the ganglionic eminences at this stage, although at higher magnification in coronal sections, it was possible to see a prominent tangential stream of cells (curved arrow) either expressing GAD2 (F) or CALB2 (G) apparently migrating from the ganglionic eminence toward the preplate. Scale bars = 50 μm in A, B, C; 500 μm in F, G; and 2 mm in D, E.
Figure 7.
Figure 7.
Laminar expression of GABAergic immunoreactivity at 9 PCW. ASCL1, DLX2, and GAD2 show similar patterns of immunoreactivity at 9 PCW, with a mosaic of cells exhibiting either strong, moderate, and weak/no expression throughout the layers of the cortical wall. They differed in that ASCL1 expression was generally more prominent in the VZ, whereas DLX2 was stronger in the SVZ. GAD2 immunoreactivity was observed in proliferative layers as well as in postmitotic cells. In the cortical plate (CP), most GABAergic markers showed more expression in cells closer to the outer boundary with the marginal zone. The exception was CALB2 immunoreactivity, which was most prominent in cells at the interface between the CP and the early subplate (SP/IZ). CALB2-positive fibrers were also seen extending into the intermediate zone (IZ), but no CALB2-positive cells were seen in the SVZ/VZ at this stage. Scale bar = 200 μm.
Figure 8.
Figure 8.
Laminar expression of GABAergic genes at 12 PCW. Panel (A) shows at low magnification the expression of GAD1 and DLX2 by ISH, and DLX2 and CALB2 by IHC. GAD1 expression indicated the presence of GABAergic neurons in the cortical plate at this stage, and the expression of DLX2/DLX2 in the proliferative zones suggests that GABAergic cells may have been generated intracortically at this stage. This stage of development is noticeable for the appearance of CALB2 immunoreactive neurons in the VZ, SVZ, and intermediate zones. At higher magnification (B), many of these CALB2-positive cells appeared migratory, but have a mix of orientations suggestive of tangential or radial migration. Note that the marginal zone (MZ) has a cell-containing outer layer (subpial granular layer) at this age. Scale bar = 500 μm in A; 100 μm in B.
Figure 9.
Figure 9.
Double labeling of GABAergic interneuron precursors with the cell-division marker Ki67. Ki67 immunofluorescence (red) was observed in many cell nuclei throughout the proliferative layers of the neocortex. This coincided with expression of the transcription factors ASCL1 and DLX2 (green) and a majority of cells appeared double labeled for Ki67 and either one of the transcription factors (yellow, 9A,B). DLX2 was less widely expressed than ASCL1, being largely confined to the ISVZ (B). CALB2 was also widely expressed in the SVZ (green, C) but was not seen to be co-expressed with Ki67. Scale bar = 100 μm.

References

    1. Abrahams BS, Tentler D, Perederiy JV, Oldham MC, Coppola G, Geschwind DH. Genome-wide analyses of human perisylvian cerebral cortical patterning. Proc Natl Acad Sci USA. 2008;104:17849–17854. doi: 10.1073/pnas.0706128104. - DOI - PMC - PubMed
    1. Ballesteros Yáñez I, Muñoz A, Contreras J, Gonzalez J, Rodriguez-Veiga E, DeFelipe J. Double bouquet cell in the human cerebral cortex and a comparison with other mammals. J Comp Neurol. 2005;486:344–360. doi: 10.1002/cne.20533. - DOI - PubMed
    1. Bayatti N, Moss JA, Sun L, Ambrose P, Ward JFH, Lindsay S, Clowry GJ. A molecular neuroanatomical study of the developing human neocortex from 8 to 17 postconceptional weeks revealing the early differentiation of the subplate and subventricular zone. Cereb Cortex. 2008;18:1536–1548. doi: 10.1093/cercor/bhm184. - DOI - PMC - PubMed
    1. Bayatti N, Sarma S, Shaw C, Eyre JA, Vouyiouklis DA, Lindsay S, Clowry GJ. Progressive loss of PAX6, TBR2, NEUROD and TBR1 mRNA gradients correlates with translocation of EMX2 to the cortical plate during human cortical development. Eur J Neurosci. 2008;28:1449–1456. doi: 10.1111/j.1460-9568.2008.06475.x. - DOI - PMC - PubMed
    1. Behar TN, Schaffner AE, Scott CA, Greene CL, Barker JL. GABA Receptor antagonists modulate postmitotic cell migration in slice cultures of embryonic rat cortex. Cereb Cortex. 2000;10:899–909. doi: 10.1093/cercor/10.9.899. - DOI - PubMed

Publication types

MeSH terms