. 2013:4:2445.
doi: 10.1038/ncomms3445.

Draft genome sequence of the mulberry tree Morus notabilis

Affiliations
Free PMC article

Draft genome sequence of the mulberry tree Morus notabilis

Ningjia He et al. Nat Commun. 2013.
Free PMC article

Abstract

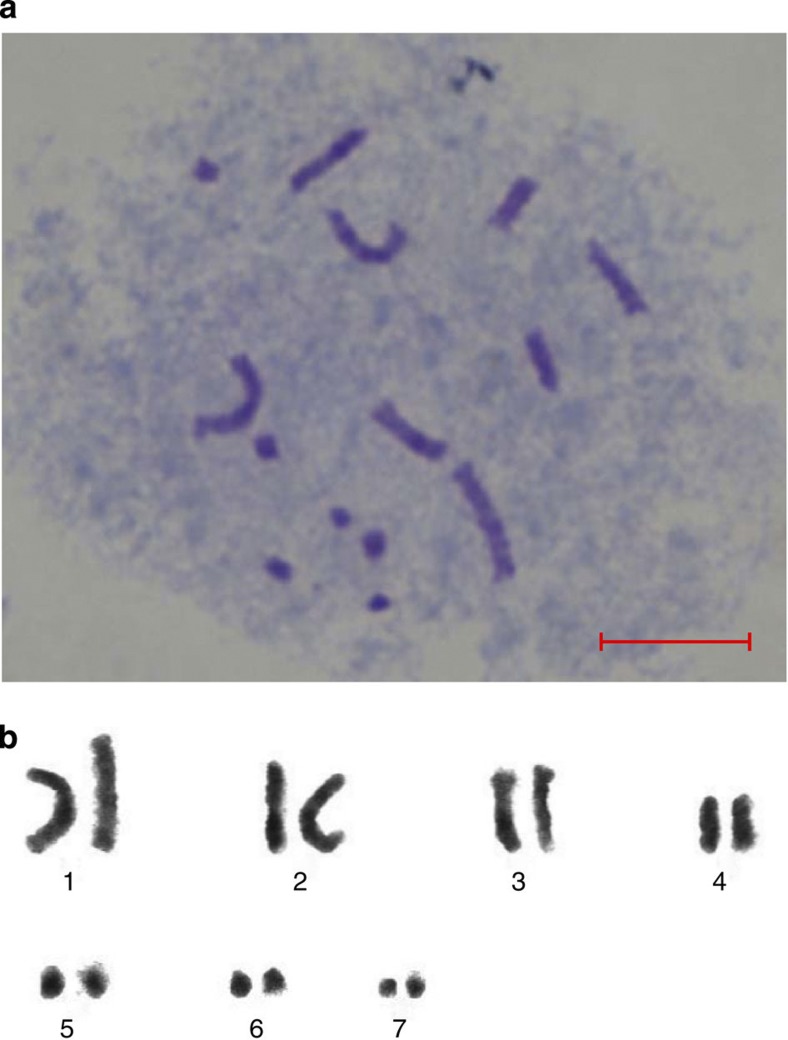
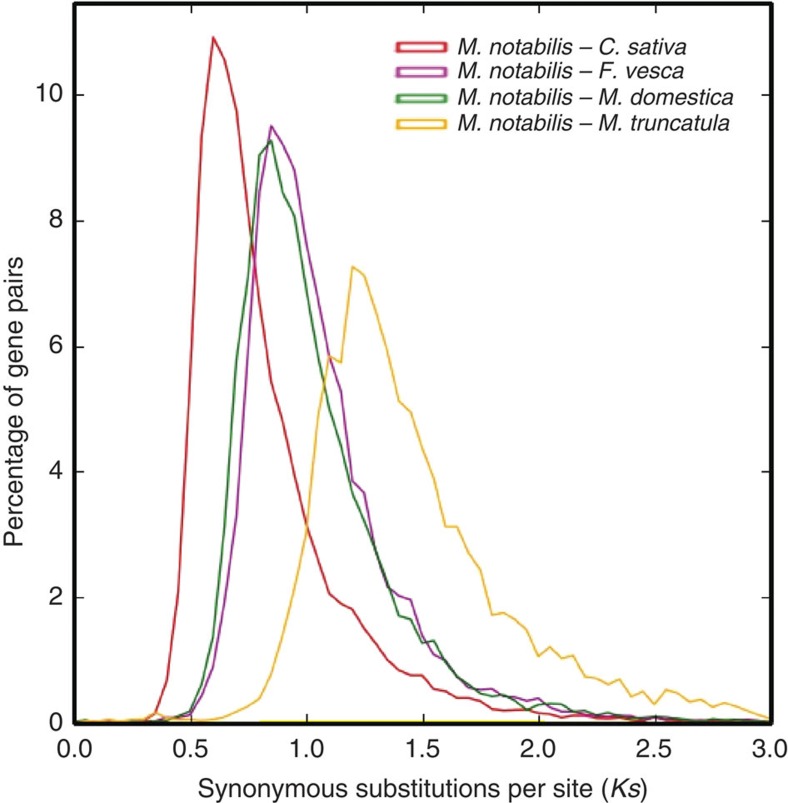
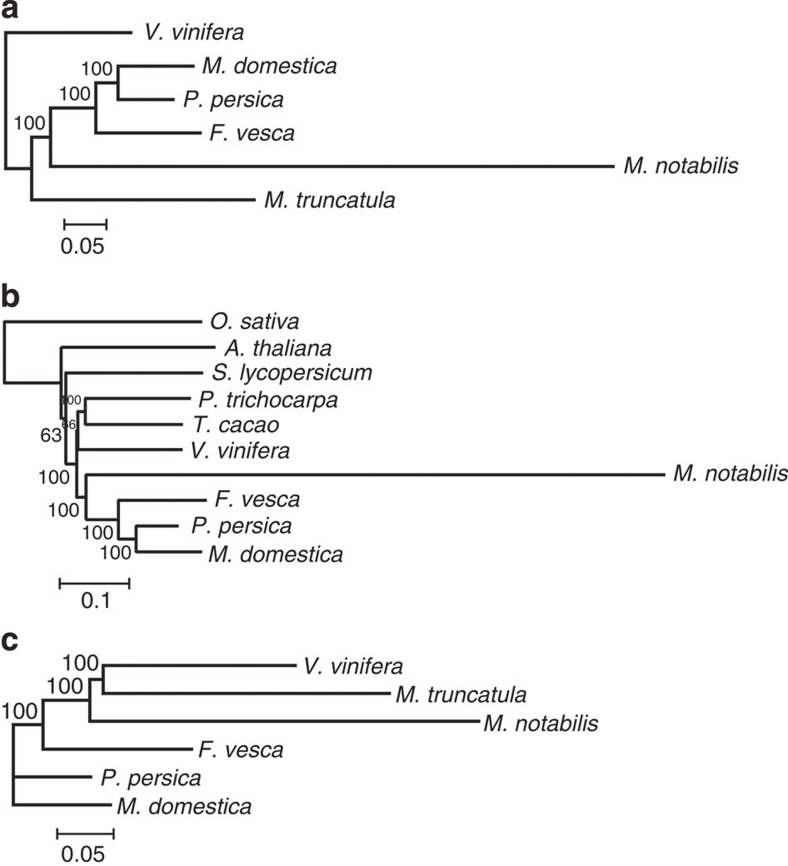
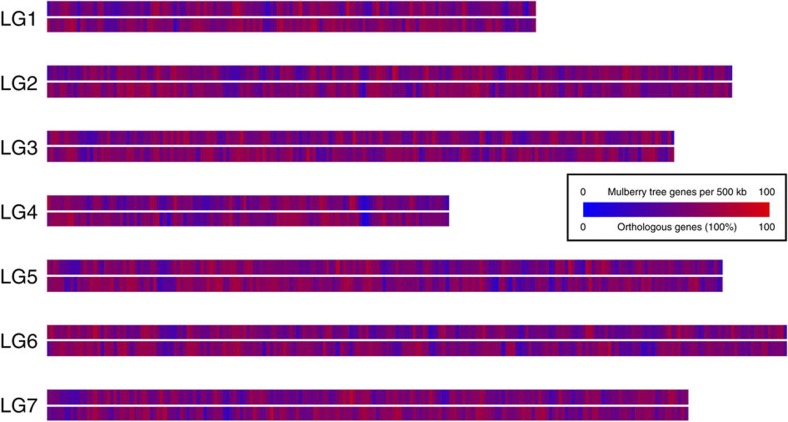
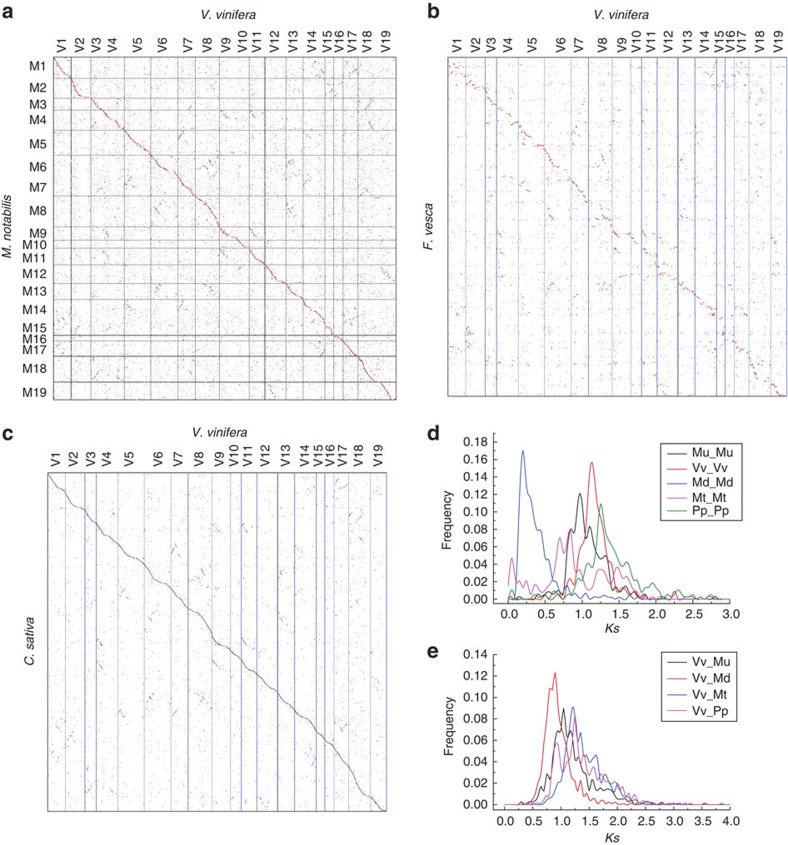
Human utilization of the mulberry-silkworm interaction started at least 5,000 years ago and greatly influenced world history through the Silk Road. Complementing the silkworm genome sequence, here we describe the genome of a mulberry species Morus notabilis. In the 330-Mb genome assembly, we identify 128 Mb of repetitive sequences and 29,338 genes, 60.8% of which are supported by transcriptome sequencing. Mulberry gene sequences appear to evolve ~3 times faster than other Rosales, perhaps facilitating the species' spread worldwide. The mulberry tree is among a few eudicots but several Rosales that have not preserved genome duplications in more than 100 million years; however, a neopolyploid series found in the mulberry tree and several others suggest that new duplications may confer benefits. Five predicted mulberry miRNAs are found in the haemolymph and silk glands of the silkworm, suggesting interactions at molecular levels in the plant-herbivore relationship. The identification and analyses of mulberry genes involved in diversifying selection, resistance and protease inhibitor expressed in the laticifers will accelerate the improvement of mulberry plants.


Figures

Figure 1
Figure 1. Cytological analysis of M. notabilis chromosomes.
(a) Cytological detection of M. notabilis chromosomes. (b) Chromosome karyotyping of M. notabilis. Scale bar, 10 μm.
Figure 2
Figure 2. Phylogenetic relationships of 13 plant species.
The species are: M. notabilis, T. cacao, A. thaliana, P. trichocarpa, S. lycopersicum, V. vinifera, P. bretschneideri, M. domestica, P. persica, F. vesca, C. sativa, M. truncatula and O. sativa. The scale bar indicates 7.5 million years. The values at the branch points indicated the estimates of divergence time (mya) with a 95% credibility interval.
Figure 3
Figure 3. Ks distribution plot.
The red, magenta, green and yellow lines represent Ks distribution of orthologous gene pairs in M. notabilisC. sativa, M. notabilisF. vesca, M. notabilisM. domestica and M. notabilisM. truncatula, respectively.
Figure 4
Figure 4. Phylogenetic trees of M. notabilis and other plants.
Different data set were used to construct a phylogeny of the considered species. (a) A tree constructed using 136 single genes in the predicted M. notabilis gene data sets and their best-matched ones. (b) A tree constructed using 62 single genes predicted by Genewise in 10 plants. (c) A tree constructed using 318 best-matched collinear genes across 6 plant genomes. The scale of a unit is shown below each tree and the number on it shows how many amino acid substitutions per sites.
Figure 5
Figure 5. In-silico staining of M. notabilis gene models against F. vesca.
Using a sliding window approach (500 kb), the total gene density (upper track) and the relative distribution of orthologous genes (lower track) were calculated for M. notabilis.
Figure 6
Figure 6. Dotplots of species and Ks distributions.
M. notabilisV. vinifera (a), F. vescaV. vinifera (b), C. sativaV. vinifera (c) and Ks distribution of within-each-plant homologues (d) and between-different-plant homologues (e) in collinearity. For M. notabilis and C. sativa, gene coding DNA sequences of V. vinifera were searched against their genomes by using BLASTN, and their hit locations were found. This BLASTN information was used to produce the dotplots. Unanchored scaffolds were linked together as to their best-matched grape genomic regions, and the putative pseudochromosomal regions of M. notabilis and C. sativa genomes were produced. For F. vesca, protein–protein searches using BLASTP were conducted to reveal putative homologous genes, and this information was used to make dotplot; along chromosomes, genes were placed with their chromosomal order as coordinates.

Similar articles

Cited by

References

    1. Barber E. J. W. Prehistoric Textiles: The Development Of Cloth In The Neolithic And Bronze Ages With Special Reference To The Aegean Princeton University Press (1991).
    1. Clement W. L. & Weiblen G. D. Morphological evolution in the mulberry family (Moraceae). Syst. Bot. 34, 530–552 (2009).
    1. Nepal M. P. & Ferguson C. J. Phylogenetics of Morus (Moraceae) inferred from ITS and trnL-trnF sequence data. Syst. Bot. 37, 442–450 (2012).
    1. Sánchez M. D. World distribution and utilization of mulberry, potential for animal feeding. FAO Electron. Conf. Mulberry Animal Prod. (Morus1-L) 1–11 (2000).
    1. Kim S. Y. et al. Antioxidative flavonoids from the leaves of Morus alba. Arch. Pharm. Res. 22, 81–85 (1999). - PubMed

Publication types

MeSH terms