. 2014 Jan;22(1):18-27.
doi: 10.1038/mt.2013.219. Epub 2013 Sep 19.

Tissues in different anatomical sites can sculpt and vary the tumor microenvironment to affect responses to therapy

Affiliations

Tissues in different anatomical sites can sculpt and vary the tumor microenvironment to affect responses to therapy

Christel Devaud et al. Mol Ther. 2014 Jan.

Abstract

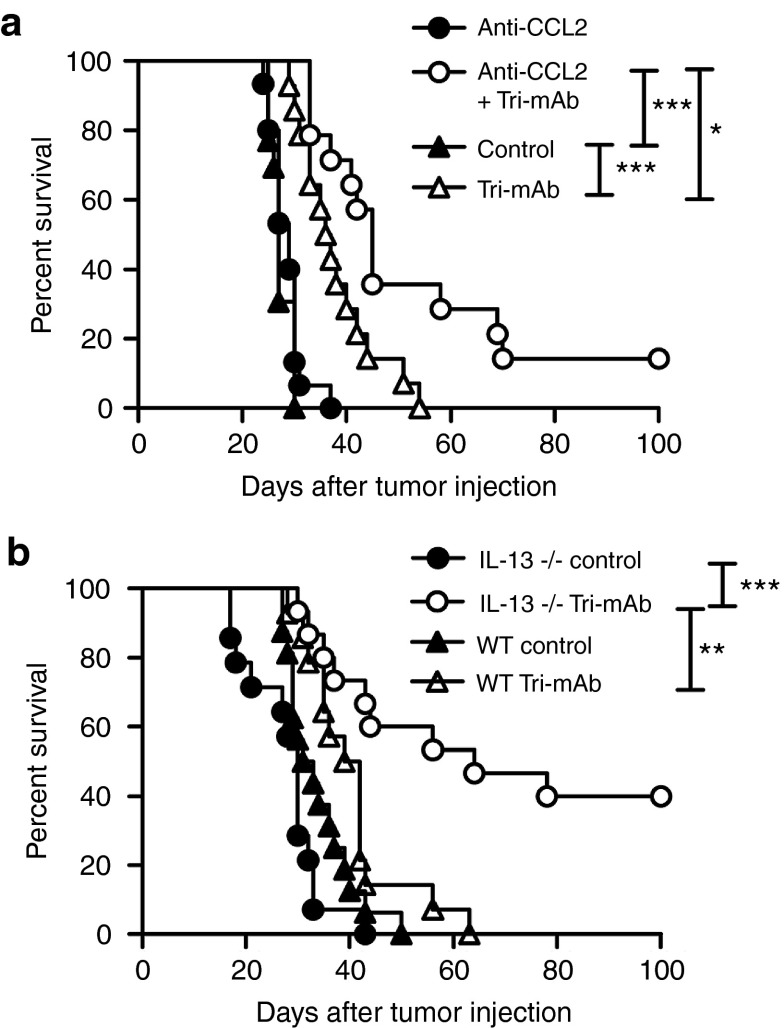
The tumor microenvironment can promote tumor growth and reduce treatment efficacy. Tumors can occur in many sites in the body, but how surrounding normal tissues at different anatomical sites affect tumor microenvironments and their subsequent response to therapy is not known.We demonstrated that tumors from renal, colon, or prostate cell lines in orthotopic locations responded to immunotherapy consisting of three agonist antibodies, termed Tri-mAb, to a much lesser extent than the same tumor type located subcutaneously. A tissue-specific response to Tri-mAb was confirmed by ex vivo separation of subcutaneous (SC) or orthotopic tumor cells from stromal cells, followed by reinjection of tumor cells into the opposite site. Compared with SC tumors, orthotopic tumors had a microenvironment associated with a type 2 immune response, related to immunosuppression, and an involvement of alternatively activated macrophages in the kidney model. Orthotopic kidney tumors were more highly vascularized than SC tumors. Neutralizing the macrophage- and Th2-associated molecules chemokine (C-C motif) ligand 2 or interleukin-13 led to a significantly improved therapeutic effect. This study highlights the importance of the tissue of implantation in sculpting the tumor microenvironment. These are important fundamental issues in tumor biology and crucial factors to consider in the design of experimental models and treatment strategies.


Figures

Figure 1
Figure 1
Tri-mAb inhibits orthotopic tumors less than subcutaneous (SC) tumors. (a) Survival of mice injected with Renca, renal carcinoma cells, subcutaneously or orthotopically into the right kidney cortex (intrakidney (IK)) (n = 7–8 per group, representative experiment of 5). (b) Survival of mice injected with CT26, colon carcinoma cells, subcutaneously or orthotopically into the cecum (intracecum (IC)) (n = 7–9 per group, representative experiment of 2). (c) Tumor weight at day (D) 12 of RM-1, prostate carcinoma cells, injected SC or into the prostate (intraprostrate (IPr)) (n = 7–9 per group, representative experiment of 2). (d) Survival of mice injected with Renca cells in SC sites or into one liver lobe (intrahepatically (IH)) (n = 6–7 per group). (e) Tumor growth, following SC injection with Renca-cherry-luciferase (Renca-Ch-Luc), was monitored using calipers (n = 6, representative experiment of 3). (f,g) Bioluminescence emission imaging was used to monitor Renca IK tumor development (n = 6, representative experiment of 3). Mice were treated with Tri-mAb or isotype controls (Ctls) when tumors were established (~20–30 mm2). *P < 0.05. **P < 0.005. ***P < 0.0005.
Figure 2
Figure 2
The host normal tissue contributes to directing the composition of the tumor microenvironment. (a) After 4 weeks in culture, Renca-cherry-luciferase (Renca-Ch-Luc) tumor cells isolated from subcutaneous (SC) and intrakidney (IK) tumors at day 12 (three of each) were stained for the markers listed. Cells were analyzed using flow cytometry relative to the original parental Renca-Ch-Luc cell line maintained in vitro. (b) Tumor growth (±SEM) and (c) survival of mice that received SC and IK Renca cell lines injected at SC sites (SC inj.) or IK (IK inj.). Mice were treated with Tri-mAb or control (Ctl) antibodies. (n = 7–8. ***P < 0.005 for (b) Tri-mAb–treated versus Ctl groups).
Figure 3
Figure 3
Kidney tumors contain a higher proportion of F4/80hi / CD206+ macrophages. (ag) Similar leukocytes infiltrate intrakidney (IK) and subcutaneous (SC) tumors. SC and IK Renca tumors were removed on day 10–12 after inoculation. (h,i) Plot of macrophage populations from representative SC and IK tumors after staining for the macrophage markers F4/80 and CD11b. (j) The relative frequency of F4/80hi and F4/80int macrophages in SC and IK tumors. (k,l) Representative flow cytometry plots and (m) quantitative data of CD206 expression on F4/80hi and F4/80int macrophages from IK tumors at day 12 after inoculation. (Average ± SEM, n ≥ 5, representative of at least three experiments for all panels). *P < 0.05. ***P < 0.0005. (n) Agarose gel from reverse transcriptase–polymerase chain reaction on RNA from F4/80hi and F4/80int macrophages, sorted from IK tumors at day 12 on the basis of their level of F4/80 expression using alternatively activated macrophage–associated genes Mgl1(670 bp), Arg1 (881 bp) and the housekeeping gene HPRT (250 bp) as depicted. Tregs, regulatory T cells.
Figure 4
Figure 4
Increased gene expression and protein in intrakidney (IK) and subcutaneous (SC) tumors and associated macrophages. (a) Gene expression significantly upregulated in IK tumors (left panel, white bars) or SC tumors (right panel, black bars), following analysis of tumor RNA using an reverse transcriptase–polymerase chain reaction array. (b) Protein significantly upregulated in IK tumors (left panels) or SC tumors (right panel) following analysis of tumor lysates using a protein array. a,b) represent three Renca tumors, isolated at day 10–12 after inoculation (before treatment), from three different mice. (c) Cytometric bead array analysis of macrophage, isolated from IK tumors at day 12 on the basis of their level of F4/80-CD11b expression, supernatants from overnight culture. Cytokines produced by F4/80hi or F4/80int macrophages (results pooled from two experiments, each with duplicate wells). (d) Serum from mice bearing IK or SC tumors at day 12 was analyzed for levels of cytokines and chemokines using cytometric bead array, only significant difference between both sera (CCL2) is depicted (average ± SEM, n = 5). *P < 0.05, ***P < 0.0005. CCL, CC chemokine ligand.
Figure 5
Figure 5
CCL2 and IL-13 are involved in the differential responses of tumors in the two anatomical locations. (a) Survival of mice with 10- to 12-day established intrakidney (IK) tumors, treated with Tri-mAb or control antibodies (day 10, 14, and 18) in the presence or absence of a blocking antibody specific for CCL2 (day 6, 10, 14, and 18). Data pooled from two experiments. n = 14 per group. (b) Survival of IL-13–deficient or wild-type (WT) BALB/c mice with 10- to 12-day established IK tumors, treated with Tri-mAb or control antibodies (day 10, 14, and 18). Data pooled from two experiments. n = 13–15 per group. *P < 0.05. **P < 0.005. *** P < 0.0005. CCL, CC chemokine ligand; IL, interleukin.
Figure 6
Figure 6
Intrakidney (IK) tumors have a greater density of CD31+ cells. (a) Sections of Renca tumors, taken from mice at day 12 after injection and stained with anti-CD31 or isotype control antibodies, one representative view per tumor (IK and SC), scale bar = 100 µm (b) CD31 expression depicted as pixel density for five IK and five SC tumors (three sections per tumor, ten fields of each). (c) Diffusion of Evans blue dye into IK and SC tumors following intravenous injection in mice 30 minutes before. Results pooled from two experiments ±SEM, n = 19 per group. (df) Tri-mAb localization in (d) SC and IK tumors, (e) blood, and (f) skin following I-125 radiolabeled Tri-mAb antibodies injected intraperitoneally. Tissues were analyzed in cohorts of mice at 4, 24, 48, and 72 hours after Tri-mAb injection. Results represented as ±SEM, n = 4–5 tumors per group. *P < 0.05. **P < 0.005.

Similar articles

Cited by

References

    1. Shevach EM. Biological functions of regulatory T cells. Adv Immunol. 2011;112:137–176. - PubMed
    1. Marigo I, Dolcetti L, Serafini P, Zanovello P, Bronte V. Tumor-induced tolerance and immune suppression by myeloid derived suppressor cells. Immunol Rev. 2008;222:162–179. - PubMed
    1. Ruffell B, Affara NI, Coussens LM. Differential macrophage programming in the tumor microenvironment. Trends Immunol. 2012;33:119–126. - PMC - PubMed
    1. Teng MW, Ngiow SF, von Scheidt B, McLaughlin N, Sparwasser T, Smyth MJ. Conditional regulatory T-cell depletion releases adaptive immunity preventing carcinogenesis and suppressing established tumor growth. Cancer Res. 2010;70:7800–7809. - PubMed
    1. Gazzaniga S, Bravo AI, Guglielmotti A, van Rooijen N, Maschi F, Vecchi A, et al. Targeting tumor-associated macrophages and inhibition of MCP-1 reduce angiogenesis and tumor growth in a human melanoma xenograft. J Invest Dermatol. 2007;127:2031–2041. - PubMed

Publication types

MeSH terms

Substances