. 2013 Sep 18;33(38):15109-19.
doi: 10.1523/JNEUROSCI.2110-13.2013.

Enhanced excitability of thalamic sensory neurons and slow-wave EEG pattern after stimuli that induce spinal long-term potentiation

Affiliations

Enhanced excitability of thalamic sensory neurons and slow-wave EEG pattern after stimuli that induce spinal long-term potentiation

Raul Sanoja et al. J Neurosci. .

Abstract

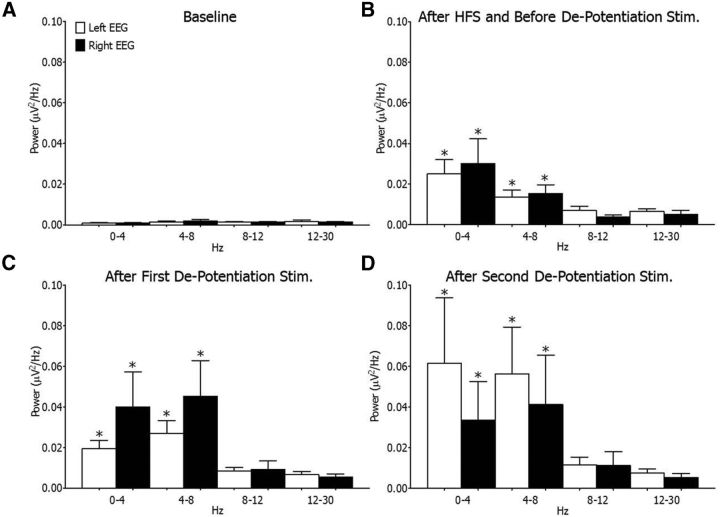
Spinal nociceptive neurons are well known to undergo a process of long-term potentiation (LTP) following conditioning by high-frequency sciatic nerve stimulation (HFS) at intensities recruiting C-fibers. However, little if any information exists as to whether such HFS conditioning that produces spinal LTP affects sensory transmission at supraspinal levels. The present study explored this possibility. Conventional extracellular recording methods were used to examine the consequences of HFS versus sham HFS conditioning on individual wide-dynamic range thalamic neurons located in the ventro-postero-lateral (VPL) nucleus in isoflurane-anesthetized rats. Following HFS, the ongoing firing rate and stimulus-evoked (brush, pinch, sciatic nerve) responses were markedly enhanced as were responses to juxtacellular, microiontophoretic applications of glutamate. These HFS-induced enhancements lasted throughout the recording period. Sham stimuli had no effect on VPL neuron excitability. Cortical electroencephalographic (EEG) wave activities were also measured around HFS in conjunction with VPL neuron recordings. The cortical EEG pattern under baseline conditions consisted of recurring short duration bursts of high-amplitude slow waves followed by longer periods of flat EEG. Following HFS, the EEG shifted to a continuous large-amplitude, slow-wave pattern within the 0.5-8.0 Hz bandwidth lasting throughout the recording period. Sham HFS did not alter EEG activity. Sciatic nerve conditioning at A-δ fiber strength, known to reverse spinal LTP, did not alter enhanced neuronal excitability or the EEG slow-wave pattern induced by HFS. These data support the concept that HFS conditioning of the sciatic nerve, which leads to spinal LTP, is associated with distinct, long-lasting changes in the excitability of neurons comprising thalamocortical networks.


Figures

Figure 1.
Figure 1.
Experimental scheme.
Figure 2.
Figure 2.
A, B, Oscilloscope traces of innocuous (brush) and noxious (pinch, C-fiber stimulation of sciatic nerve) stimuli on spike activity of a thalamic VPL neuron before (A) and after HFS (B). Note the characteristic spike responses after each stimulus. Following sham, brush and pinch responses were indistinguishable versus their control response. High-frequency after-discharges occurred following each stimulus type after HFS. C, D, Histogram plots depicting the time course effect of sham HFS (C) and HFS (D) on brush, pinch, and sciatic nerve “C-fiber” stimulus-evoked response magnitude of thalamic VPL neurons. Each histogram bar represents the group mean (±SEM) response in spikes per stimulus application at different time points for all VPL neurons tested (n = 40). Note the marked and sustained enhancement in innocuous and noxious stimulus-induced VPL response magnitude following HFS (n = 30 neurons in 15 rats) but not sham HFS (n = 10 neurons in 7 rats, *p < 0.05, **p < 0.01, one-way ANOVA, Dunn's multiple-comparison test).
Figure 3.
Figure 3.
A, Effect of HFS and sham stimuli applied to sciatic nerve on thalamic VPL neuron spike rate in the isoflurane-anesthetized rat preparation. Baseline spike rate (n = 30 neurons in 15 rats) was <0.25 Hz and gradually increased following HFS but not sham HFS (n = 10 neurons in 7 rats; *p < 0.05; **p < 0.01, ***p < 0.001, Dunn's multiple-comparison test). B, Effect of HFS stimuli applied to the sciatic nerve on thalamic VPL neuron spike burst event activities. Each histogram bar represents the mean ± SE of the number of events detected in a 4 min epoch under baseline pre-HFS conditions and 2 h following HFS stimuli in 30 neurons. Note that before HFS stimuli, very few burst events occurred (white histogram bars) that consisted of three or four action potentials. However, following HFS, the mean number of burst events and the number of action potentials per burst increased dramatically as did the number of action potentials per burst event.
Figure 4.
Figure 4.
HFS enhancement of GLU-evoked excitations of thalamic VPL neurons. A, The top left traces represent oscilloscope traces of a single VPL neuron‘s spike activity and spike template recorded in spike acquisition software during a single GLU pulse ejection. B, The rate meter traces of pulsatile GLU ejections on the same VPL neuron over a 5 min period before and 30 min after HFS. Note the marked increase in consecutive GLU-evoked responses following HFS. The overall time course of the HFS effect on GLU response magnitude overlapped with that for pinch, brush, and C-fiber evoked responses, see Figure 2. C, The time expanded rate-meter plots reflect computer-averaged (bin by bin) plots of the eight individual GLU-responses in B. E, HFS also significantly shortened the 50% time to maximum response (E) and steepened the slope of the rising phase (G) of excitation by juxtacellular glutamate in this neuron. The histogram bars in D, F, and H represent the group mean (±SEM) average magnitude, 50% time to max and slope of the response onset to GLU, respectively, for 10 VPL neurons in six rats before and after HFS (*p < 0.05, Mann–Whitney rank sum test).
Figure 5.
Figure 5.
Effect of HFS on EEG waveform activity in the isoflurane-anesthetized rat preparation. A, Examples of EEG activity (60 s) recorded from the right and left parietal cortex under control baseline (top left), sham (top middle, n = 7 rats), and 1 h following HFS (top right, n = 15 rats) from one experiment. Lower two traces in A are time-expanded views of the EEG activity encompassed by the dashed boxed enclosures to illustrate the burst–pause baseline EEG waveform signature replaced by a permanent pattern of recurring, large-amplitude slow waves following HFS. B, Time course plots illustrating group mean (±SEM) FFT power of left and right parietal cortical EEG activity in δ (0–4 Hz), θ (4–8 Hz), α (8–12 Hz), and β (12–30 Hz) bandwidths from all experiments where HFS was used (n = 15; *p < 0.05, **p < 0.01, one-way ANOVA, Dunn's multiple-comparison test). Sustained power increases were noted in δ and θ bandwidths within 5 min post HFS bilaterally compared with corresponding baseline (−30 to −10 min), which lasted throughout the entire experiment. Significant and sustained increases in α and β power occurred 2 and 3 h post-HFS. There were no significant changes in EEG activity following sham stimuli. Immediately following HFS, the right EEG δ and θ power increased by 20- and 21-fold while the left δ and θ power increased 10- and 12-fold, respectively, when compared with baseline.
Figure 6.
Figure 6.
A, Resilience of enhanced thalamic VPL neuron activity following HFS to depotentiation stimuli (Liu et al., 1998; Sandkühler, 2007). The solid histogram bars in A–C depict the group mean (±SEM) thalamic VPL neuron responses to brush (A) and sciatic nerve “C-fiber” stimulus-evoked response magnitude (B), as well as pinch (C). Each open histogram bar represents the group mean response in spikes per stimulus application over a 4 h epoch for all VPL neurons tested (n = 14) after initial or secondary spinal depotentiation stimuli. Depotentiation stimuli did not alter evoked (one-way ANOVA: Friedman test: p > 0.05 for brush, pinch, and sciatic nerve C-fiber stimuli) or ongoing spike activities (D) in 14 neurons examined in seven rats.
Figure 7.
Figure 7.
FFT power plots of EEG activity before (A) and after HFS (B), and subsequently after depotentiation stimuli applied to the sciatic nerve (C, D). Data are expressed as histogram bars representing the group mean (±SEM) power values for respective bandwidths around HFS stimuli and depotentiation stimuli. A, Baseline power values in δ and θ bands undergo a marked increase following HFS (in B–D: *p < 0.05, one-way ANOVA, Dunn's multiple-comparison test vs corresponding values in A). The first trial of depotentiation stimuli (C) did not alter δ and θ bandwidth power versus that which was consistently observed following HFS. A second trial of depotentiation stimuli (D) also did not alter δ and θ bandwidths (p > 0.05, one-way ANOVA, Dunn's multiple-comparison test).
Figure 8.
Figure 8.
Localization of recording sites of WDR units in the rat thalamus. Photomicrograph on the upper left shows an example of a lesion site (boxed enclosure). Drawings show localization of VPL neurons recorded in each experiment. Coronal sections adapted from the atlas of Paxinos and Watson (2007). Numbers indicate distance in millimeters from bregma. Scale indicates distance from the cortex. Thalamic nuclei: VPM/L, ventro-postero-medial/lateral; LDVL, latero-dorsal, ventro-lateral; Po, post-thalamic group.

Similar articles

Cited by

References

    1. Benrath J, Brechtel C, Martin E, Sandkühler J. Low doses of fentanyl block central sensitization in the rat spinal cord in vivo. Anesthesiology. 2004;100:1545–1551. doi: 10.1097/00000542-200406000-00030. - DOI - PubMed
    1. Boord P, Siddall PJ, Tran Y, Herbert D, Middleton J, Craig A. Electroencephalographic slowing and reduced reactivity in neuropathic pain following spinal cord injury. Spinal Cord. 2008;46:118–123. doi: 10.1038/sj.sc.3102077. - DOI - PubMed
    1. Condés-Lara M, Sanchez-Moreno RM, Omaña-Zapata I. Cortical facilitatory action on centralis lateralis thalamic activity during the development of carrageenin-produced inflammation. Arch Med Res. 1996;27:265–273. - PubMed
    1. Fischer TZ, Tan AM, Waxman SG. Thalamic neuron hyperexcitability and enlarged receptive fields in the STZ model of diabetic pain. Brain Res. 2009;1268:154–161. doi: 10.1016/j.brainres.2009.02.063. - DOI - PubMed
    1. Gerke MB, Duggan AW, Xu L, Siddall PJ. Thalamic neuronal activity in rats with mechanical allodynia following contusive spinal cord injury. Neuroscience. 2003;117:715–722. doi: 10.1016/S0306-4522(02)00961-2. - DOI - PubMed

Publication types

MeSH terms

LinkOut - more resources