. 2013 Sep 18;33(38):15120-5.
doi: 10.1523/JNEUROSCI.2909-13.2013.

A conserved pattern of differential expansion of cortical areas in simian primates

Affiliations

A conserved pattern of differential expansion of cortical areas in simian primates

Tristan A Chaplin et al. J Neurosci. .

Abstract

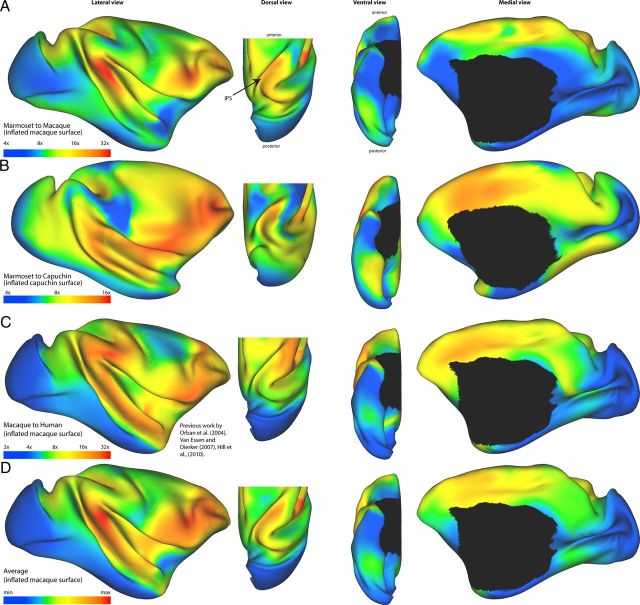
The layout of areas in the cerebral cortex of different primates is quite similar, despite significant variations in brain size. However, it is clear that larger brains are not simply scaled up versions of smaller brains: some regions of the cortex are disproportionately large in larger species. It is currently debated whether these expanded areas arise through natural selection pressures for increased cognitive capacity or as a result of the application of a common developmental sequence on different scales. Here, we used computational methods to map and quantify the expansion of the cortex in simian primates of different sizes to investigate whether there is any common pattern of cortical expansion. Surface models of the marmoset, capuchin, and macaque monkey cortex were registered using the software package CARET and the spherical landmark vector difference algorithm. The registration was constrained by the location of identified homologous cortical areas. When comparing marmosets with both capuchins and macaques, we found a high degree of expansion in the temporal parietal junction, the ventrolateral prefrontal cortex, and the dorsal anterior cingulate cortex, all of which are high-level association areas typically involved in complex cognitive and behavioral functions. These expanded maps correlated well with previously published macaque to human registrations, suggesting that there is a general pattern of primate cortical scaling.


Figures

Figure 1.
Figure 1.
Lateral views of the cortical models of the three monkey species used in this study, from smallest to largest. Scale bars, 10 mm. The models were warped to one another by anchoring to landmarks drawn as colored lines on the surface. A, Marmoset (smallest model). B, Capuchin (medium-sized model). C, Macaque (largest model).
Figure 2.
Figure 2.
The pattern of expansion of the cortex with brain size is similar across species. After registering the models from Figure 1, expansion is visualized here by coloring inflated models of the cortex, with blue and green indicating regions that have relatively low levels of expansion compared with yellow and red areas with high levels of expansion (note log scale). Each panel shows four different viewpoints, from left to right: lateral, dorsal, ventral, and medial views. In the dorsal view, only the caudal part of the brain is shown to emphasize the parietal lobe. A, Marmoset to macaque expansion shown on the macaque model. B, Marmoset to capuchin expansion shown on the capuchin model. C, Macaque to human expansion shown on the macaque model from Orban et al. (2004), Van Essen and Dierker (2007), and Hill et al. (2010). D, Average expansion between all three maps shown on the macaque model.
Figure 3.
Figure 3.
The average expansion map (from Fig. 2D) shown on cortical models of all four species, from the smallest species (marmoset) to the largest (human). The models are to scale and are colored by the average expansion map from Figure 2D. Note the expansion hotspots (red) in the temporal parietal junction and ventrolateral prefrontal cortex.
Figure 4.
Figure 4.
The non-uniform expansion of the primate cortex results in the shifting of the relative positions of cortical areas. A few of the homologous cortical areas are shown on the marmoset (left) and inflated human models (right): V1 (blue), V2 (maroon), MT/MST complex (MT+; red), auditory core (orange), primary somatosensory area (areas 3a and 3b; yellow), motor cortex (area 4, purple), area 45 (part of the frontal eye field; green), and area 10 (frontal pole; dark blue). The top row is the lateral view, and the bottom row is the medial view.

References

    1. Allman JM, Hakeem A, Erwin JM, Nimchinsky E, Hof P. The anterior cingulate cortex. The evolution of an interface between emotion and cognition. Ann N Y Acad Sci. 2001;935:107–117. doi: 10.1111/j.1749-6632.2001.tb03476.x. - DOI - PubMed
    1. Bissonette GB, Powell EM, Roesch MR. Neural structures underlying set-shifting: roles of medial prefrontal cortex and anterior cingulate cortex. Behav Brain Res. 2013;250:91–101. doi: 10.1016/j.bbr.2013.04.037. - DOI - PMC - PubMed
    1. Bourne JA, Rosa MGP. Hierarchical development of the primate visual cortex, as revealed by neurofilament immunoreactivity: early maturation of the middle temporal area (MT) Cereb Cortex. 2006;16:405–414. doi: 10.1093/cercor/bhi119. - DOI - PubMed
    1. Burman KJ, Reser DH, Yu HH, Rosa MGP. Cortical input to the frontal pole of the marmoset monkey. Cereb Cortex. 2011;21:1712–1737. doi: 10.1093/cercor/bhq239. - DOI - PubMed
    1. Changizi MA, Shimojo S. Parcellation and area-area connectivity as a function of neocortex size. Brain Behav Evol. 2005;66:88–98. doi: 10.1159/000085942. - DOI - PubMed

Publication types

LinkOut - more resources