. 2013 Sep 18;33(38):15235-47.
doi: 10.1523/JNEUROSCI.2339-13.2013.

Role of a ubiquitously expressed receptor in the vertebrate olfactory system

Affiliations

Role of a ubiquitously expressed receptor in the vertebrate olfactory system

Shannon DeMaria et al. J Neurosci. .

Abstract

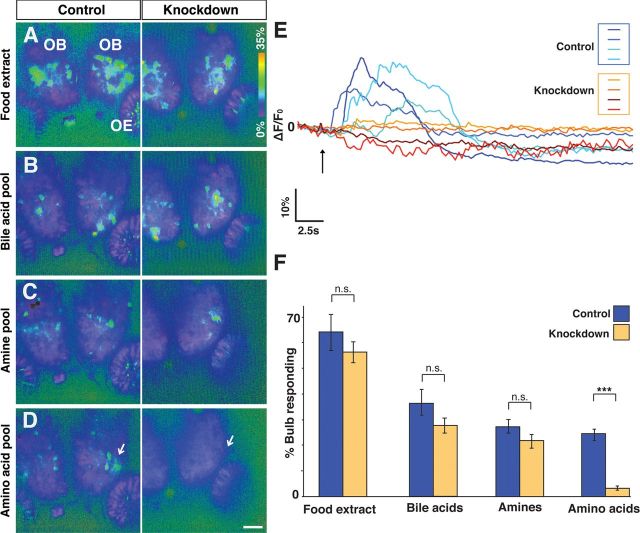
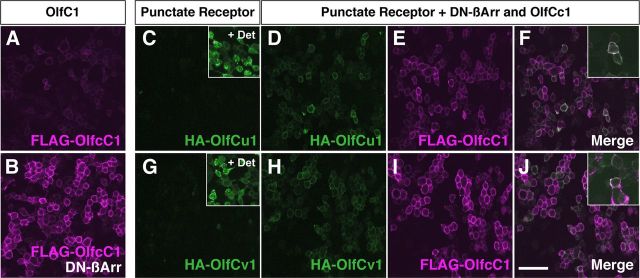
Odorant cues are recognized by receptors expressed on olfactory sensory neurons, the primary sensory neurons of the olfactory epithelium. Odorant receptors typically obey the "one receptor, one neuron" rule, in which the receptive field of the olfactory neuron is determined by the singular odorant receptor that it expresses. Odor-evoked receptor activity across the population of olfactory neurons is then interpreted by the brain to identify the molecular nature of the odorant stimulus. In the present study, we characterized the properties of a C family G-protein-coupled receptor that, unlike most other odorant receptors, is expressed in a large population of microvillous sensory neurons in the zebrafish olfactory epithelium and the mouse vomeronasal organ. We found that this receptor, OlfCc1 in zebrafish and its murine ortholog Vmn2r1, is a calcium-dependent, low-sensitivity receptor specific for the hydrophobic amino acids isoleucine, leucine, and valine. Loss-of-function experiments in zebrafish embryos demonstrate that OlfCc1 is required for olfactory responses to a diverse mixture of polar, nonpolar, acidic, and basic amino acids. OlfCc1 was also found to promote localization of other OlfC receptor family members to the plasma membrane in heterologous cells. Together, these results suggest that the broadly expressed OlfCc1 is required for amino acid detection by the olfactory system and suggest that it plays a role in the function and/or intracellular trafficking of other olfactory and vomeronasal receptors with which it is coexpressed.


Figures

Figure 1.
Figure 1.
Localization of OlfCc1 to microvillous neurons in the zebrafish olfactory epithelium. Double-label RNA in situ hybridizations were performed on tissue sections of adult zebrafish olfactory epithelium (A–D). A, OlfCc1 (magenta) is expressed in a population of cells distinct from the ciliated olfactory neurons, which are labeled by OMP (green). B, OlfCc1 (magenta) colocalizes with cells expressing TrpC2 (green), a marker of microvillous olfactory neurons. C, Punctate receptor OlfCu1 (green) is coexpressed with OlfCc1 (magenta). D, Similarly, punctate receptor OlfCv1 (green) is coexpressed with OlfCc1 (magenta). C, D, Arrows and insets indicate cells coexpressing punctate receptor with OlfCc1. E, Tissue section of adult olfactory epithelium stained with an antibody to OlfCc1 (green); nonsensory epithelium is identified by acetylated tubulin (magenta). Inset, Higher-magnification view of tissue stained with OlfCc1 antibody (apical surface is toward the top). F, Projected confocal stack of a 3-d-old zebrafish embryo labeled with OlfCc1 (green) and calretinin (magenta), demonstrating expression of OlfCc1 in embryonic microvillous olfactory sensory neurons. OE, Olfactory epithelium; OB, olfactory bulb. Scale bars: A–E, 100 μm; C–E insets, F, 50 μm.
Figure 2.
Figure 2.
OlfCc1 and Vmn2r1 are calcium-dependent amino acid-sensing receptors. HEK293 cells were transfected with DNA plasmids encoding zebrafish OlfCc1 or mouse Vmn2r1 and assayed for receptor activation by calcium imaging. A, Representative traces of cells loaded with Fura-2 in response to pools of amino acids in the presence of 10 mm CaCl2. Ligands were applied to the cells as indicated; concentrations (100, 250, 500 μm) refer to concentrations of individual amino acids within each pool. Only the pool containing the hydrophobic amino acids valine, leucine, isoleucine, and methionine elicited activity above background. B, E, Representative dose–response curves of activity in Fluo-4-loaded HEK cells expressing OlfCc1 (B) or Vmn2r1 (E) elicited by isoleucine, leucine, and valine in the presence of 10 mm CaCl2. These three ligands were the only amino acids that elicited activity in OlfCc1- and Vmn2r1-expressing HEK293 cells. Isoleucine consistently elicited the peak responses larger than those for leucine and valine. C, F, Representative dose–response curves of activity in Fluo-4-loaded cells expressing OlfCc1 (C) or Vmn2r1 (F) elicited by 250 μm isoleucine in the presence of varying concentrations of CaCl2. D, Assays were also conducted in the absence or presence of either 50 μm 2-APB or 100 nm La3+, inhibitors of calcium release-activated calcium channels. Data from multiple experiments are summarized in Table 1.
Figure 3.
Figure 3.
Amino acids activate microvillous olfactory sensory neurons in zebrafish embryos. Activity elicited by a panel of odorant mixtures was assessed in 4.5-d-old transgenic zebrafish embryos expressing the genetically encoded calcium sensor GCaMP1.6 in different classes of neurons: A–F, ciliated olfactory sensory neurons (OMP-Gal4;UAS-GCaMP1.6). G–L, microvillous olfactory sensory neurons (TrpC2-Gal4;GCaMP1.6). M–R, excitatory neurons in the olfactory bulb (HuC-Gal4;GCaMP1.6). Some neurons in the olfactory epithelium also express GCaMP under the control of the HuC-Gal4 driver. A, G, M, Baseline GCaMP fluorescence for each transgenic line. Fish were exposed to the following odorant mixtures (for specific mixture compositions, see Materials and Methods): food extract (B,H,N), bile acids (C,I,O), amines (D,J,P), and amino acids (E,K,Q). F, L, R, Traces of DeltaF/F0 for representative regions of interest responding to food extract. Food extract elicits activity broadly within the ciliated and microvillous olfactory sensory neurons, as well as across the olfactory bulb. Bile acids elicit activity mainly in ciliated neurons, whereas amino acids elicit activity in microvillous neurons and in the lateral olfactory bulb. Heat maps of DeltaF/F0 represent data acquired from a single optical plane and spanning the peak response (see Materials and Methods). OE, Olfactory epithelium; OB, olfactory bulb. Scale bar, 100 μm.
Figure 4.
Figure 4.
Patterns of activity elicited by amino acids in microvillous olfactory sensory neurons. Response of microvillous olfactory sensory neurons to food extract, a mixture of all 20 naturally occurring l-amino acids, and subpools of amino acids with different side chain properties was assessed in 4.5-d-old TrpC2-Gal4;GCaMP1.6 transgenic zebrafish embryos. A, Baseline GCaMP fluorescence for microvillous olfactory sensory neurons (TrpC2-Gal4;GCaMP1.6) in the representative fish displayed in this figure; heat maps showing responses to (B) food extract, (C) mixture of 20 amino acids at 100 μm each, (E) 100 μm glutamate (acidic), (F) isoleucine and leucine (hydrophobic) at 100 μm each, and (G) arginine and lysine (basic) at 100 μm each. D, Overlaid activity maps for food extract (pseudocolored in green) and total amino acids (pseudocolored in magenta) show widespread activity in largely overlapping populations of microvillous neurons. H, Schematic of responding cells derived from regions of activity circled in (D) illustrates that distinct subsets of cells are activated by individual subpools of amino acids. Heat maps of DeltaF/F0 represent data acquired from a single optical plane and spanning the peak response (see Materials and Methods). Scale bar, 50 μm.
Figure 5.
Figure 5.
Morpholino antisense oligonucleotide-mediated knockdown of OlfCc1 expression in zebrafish embryos. One or two cell zebrafish embryos were injected with a morpholino antisense oligonucleotide designed against OlfCc1 (“Knockdown”) or a 5-base mismatch control oligonucleotide (“Control”), fixed at 4 d of development, and analyzed by immunohistochemistry. A, B, Staining with an antibody against OlfCc1 (green) demonstrates loss of OlfCc1 expression in knockdown versus control. Embryos were counterstained with the nuclear counterstain BOBO (magenta). C, D, Simultaneous staining for calretinin (magenta) and OlfCc1 (green) indicates persistence of microvillous olfactory sensory neurons in the absence of OlfCc1 expression. E, F, Localization of ciliated olfactory sensory neurons and their axonal projections by staining for GFP in OMP-Gal4;UAS-GFP transgenic fish demonstrates that this sensory neuron population is largely unperturbed by the knockdown of OlfCc1 expression. G, H, Localization of the synaptic vesicle protein SV2 to visualize presynaptic terminals in olfactory bulb glomeruli reveals normal formation of the olfactory sensory map. All images represent projected confocal stacks through the entire olfactory epithelium (OE) and olfactory bulb (OB). Scale bar, 100 μm.
Figure 6.
Figure 6.
OlfCc1 is required for amino acid-evoked activity in microvillous olfactory sensory neurons. Transgenic TrpC2-Gal4;UAS-GCaMP embryos previously injected with perfect match (“Knockdown”) or mismatch (“Control”) OlfCc1 morpholino antisense oligonucleotides were assayed at 4.5 dpf for odorant-stimulated activity in the olfactory epithelium. A–C, Olfactory epithelium from a representative fish injected with the mismatch control oligonucleotide. D–F, Olfactory epithelium from a representative fish injected with the perfect match experimental oligonucleotide. A, D, Baseline GCaMP fluorescence for each condition. Fish were exposed to food extract (B,E) or a mixture of 9 amino acids at 100 μm each (C,F). There is a dramatic reduction in the number of responding cells in the knockdown condition. Heat maps of DeltaF/F0 represent data acquired from a single optical plane and spanning the peak response (see Materials and Methods for details). Scale bar, 100 μm. G, Odor-evoked activity was scored as the percentage of GCaMP-positive cells responding to a given stimulus; data were averaged from 14 control fish and 13 knockdown fish. Histograms represent mean ± SEM. ***p < 0.01 using a two-tailed Student's t test.
Figure 7.
Figure 7.
Effects of OlfCc1 knockdown are specific to amino acid-evoked activity. Transgenic HuC-Gal4;UAS-GCaMP embryos previously injected with perfect match (“Knockdown”) or mismatch (“Control”) OlfCc1 morpholino antisense oligonucleotides were assayed at 4.5 dpf for odorant-stimulated activity in the olfactory bulb. A–D, Activity heat maps are shown for two representative fish in response to food extract (A), bile acid pool (B), amine pool (C), and amino acid pool (D). Heat maps of DeltaF/F0 represent data acquired from a single optical plane and spanning the peak response (see Materials and Methods). Activity in response to food extract, bile acids, and amines is broad in the olfactory bulb and persists in the OlfCc1 knockdown. In contrast, amino acids elicit activity mainly in a cluster of lateral glomeruli (D, arrows); this activity is greatly diminished in the OlfCc1 knockdown. E, Representative DeltaF/F0 traces from ROIs corresponding to anatomically equivalent lateral glomerular cluster in 4 control fish (blue lines) and 4 knockdown fish (orange lines) after exposure (arrow) to the 9 amino acid pool. F, The area of olfactory bulb exhibiting significant activity above background was calculated and expressed as a percentage of the total area within a given optical section. Data were acquired from 14 control and 14 knockdown fish. Histograms represent mean percentages ± SEM. No significant difference was found between control and knockdown groups in response to food extract, bile acids, or amine stimuli (n.s., Not significant; p > 0.1, two-tailed Student's t test). In contrast, a highly significant difference was found between these two groups in their responses to amino acids (***p < 0.001).
Figure 8.
Figure 8.
OlfCc1 facilitates cell surface expression of punctate OlfC receptors in heterologous cells. HEK 293 cells were transfected with DNA expression constructs and assessed for cell surface expression of epitope-tagged OlfC receptors by immunohistochemistry on unpermeabilized cells. Cell surface expression of Flag-tagged OlfCc1 (A) is enhanced by coexpression with DN-β-arrestin (B). Punctate Olfcu1 (C) and OlfCv1 (G) show little to no detectable cell surface expression when transfected alone (insets show antibody staining in the presence of detergent). Localization of these receptors to the plasma membrane is facilitated by coexpression with OlfCc1 and DN-β-arrestin (D–F,H–J). Cotransfection of punctate receptors with DN-β-arrestin alone had no discernible effect on their localization to the cell surface. Labeled cells were visualized by confocal microscopy. Scale bar, 50 μm. F, J insets, original magnification ×2.

References

    1. Acher FC, Bertrand HO. Amino acid recognition by Venus flytrap domains is encoded in an 8-residue motif. Biopolymers. 2005;80:357–366. doi: 10.1002/bip.20229. - DOI - PubMed
    1. Alioto TS, Ngai J. The repertoire of olfactory C family G protein-coupled receptors in zebrafish: candidate chemosensory receptors for amino acids. BMC Genomics. 2006;7:309. doi: 10.1186/1471-2164-7-309. - DOI - PMC - PubMed
    1. Audet M, Bouvier M. Restructuring G-protein-coupled receptor activation. Cell. 2012;151:14–23. doi: 10.1016/j.cell.2012.09.003. - DOI - PubMed
    1. Aussel C, Marhaba R, Pelassy C, Breittmayer JP. Submicromolar La3+ concentrations block the calcium release-activated channel, and impair CD69 and CD25 expression in CD3- or thapsigargin-activated Jurkat cells. Biochem J. 1996;313:909–913. - PMC - PubMed
    1. Benton R, Sachse S, Michnick SW, Vosshall LB. Atypical membrane topology and heteromeric function of Drosophila odorant receptors in vivo. PLoS Biol. 2006;4:e20. doi: 10.1371/journal.pbio.0040020. - DOI - PMC - PubMed

Publication types

MeSH terms