. 2013 Nov;41(21):e198.
doi: 10.1093/nar/gkt834. Epub 2013 Sep 17.

DEXUS: identifying differential expression in RNA-Seq studies with unknown conditions

Affiliations

DEXUS: identifying differential expression in RNA-Seq studies with unknown conditions

Günter Klambauer et al. Nucleic Acids Res. 2013 Nov.

Abstract

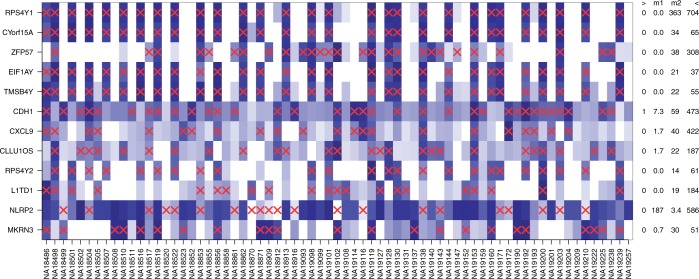
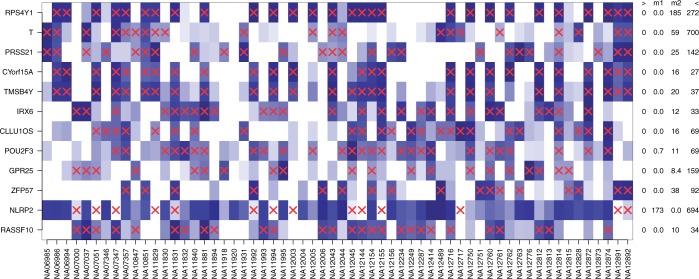
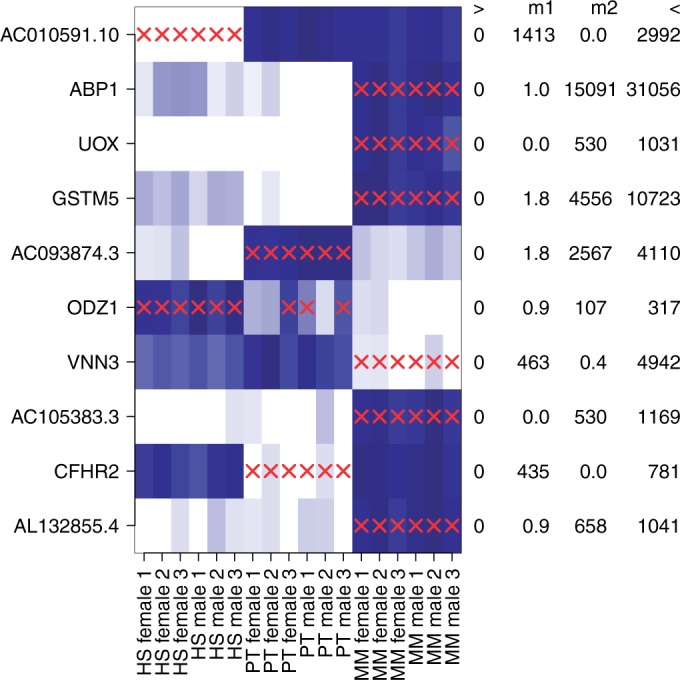
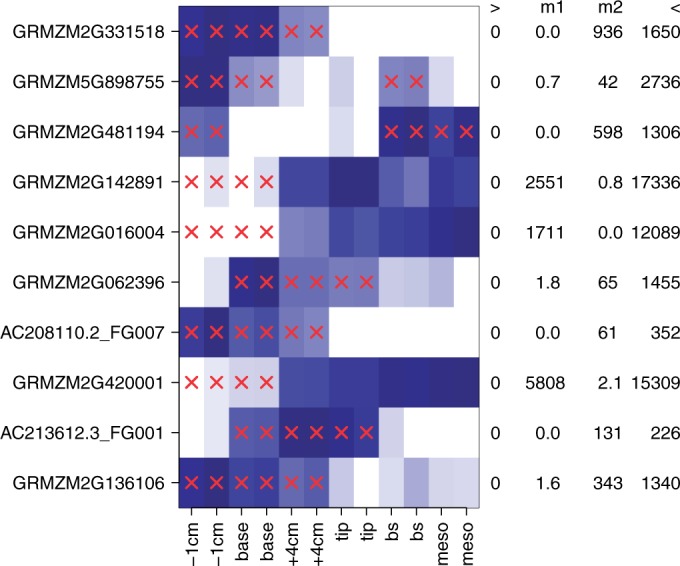
Detection of differential expression in RNA-Seq data is currently limited to studies in which two or more sample conditions are known a priori. However, these biological conditions are typically unknown in cohort, cross-sectional and nonrandomized controlled studies such as the HapMap, the ENCODE or the 1000 Genomes project. We present DEXUS for detecting differential expression in RNA-Seq data for which the sample conditions are unknown. DEXUS models read counts as a finite mixture of negative binomial distributions in which each mixture component corresponds to a condition. A transcript is considered differentially expressed if modeling of its read counts requires more than one condition. DEXUS decomposes read count variation into variation due to noise and variation due to differential expression. Evidence of differential expression is measured by the informative/noninformative (I/NI) value, which allows differentially expressed transcripts to be extracted at a desired specificity (significance level) or sensitivity (power). DEXUS performed excellently in identifying differentially expressed transcripts in data with unknown conditions. On 2400 simulated data sets, I/NI value thresholds of 0.025, 0.05 and 0.1 yielded average specificities of 92, 97 and 99% at sensitivities of 76, 61 and 38%, respectively. On real-world data sets, DEXUS was able to detect differentially expressed transcripts related to sex, species, tissue, structural variants or quantitative trait loci. The DEXUS R package is publicly available from Bioconductor and the scripts for all experiments are available at http://www.bioinf.jku.at/software/dexus/.


Figures

Figure 1.
Figure 1.
Heatmap of the normalized read counts of the 12 genes with the largest I/NI values for the ‘Nigerian HapMap’ data set. Colors range from white for low expression to blue for high expression. Different individuals are denoted along the x-axis, while the top-ranked genes are denoted by their gene symbols along the y-axis. Red crosses indicate samples that belong to the minor condition. At the right side of the heatmap, each gene is annotated by the minimum (‘>’), the median of two conditions (‘m1’ and ‘m2’) and the maximum (‘<’) read count.
Figure 2.
Figure 2.
Heatmap of the normalized read counts of the 12 genes with the largest I/NI values for the ‘European HapMap’ data set. Colors range from white for low expression to blue for high expression. Different individuals are denoted along the x-axis, while the top-ranked genes are denoted by their gene symbols along the y-axis. Red crosses indicate samples that belong to the minor condition. At the right hand side of the heatmap, each gene is annotated by the minimum (‘>’), the median of two conditions (‘m1’ and ‘m2’) and the maximum (‘<’) read count.
Figure 3.
Figure 3.
Heatmap of the normalized read counts of the 10 genes with the largest I/NI values for the ‘Primate Liver’ data set. Colors range from white for low expression to blue for high expression. The x-axis shows female and male individuals from the three species human Homo sapiens (HS), chimpanzee P. troglodytes (PT) and rhesus macaques M. mulatta (MM). The y-axis displays top-ranked genes indicated by their gene symbols. Red crosses mark samples that were assigned to the minor condition. At the right side of the heatmap, each gene is annotated by the minimum (‘>’), the median of two conditions (‘m1’ and ‘m2’) and the maximum (‘<’) read count.
Figure 4.
Figure 4.
Heatmap of the normalized read counts of the 10 genes with the largest DEXUS I/NI values for the ‘Maize Leaves’ data set. Colors range from white for low expression to blue for high expression. The x-axis shows samples from different locations on the maize plant leaf. The y-axis displays different genes denoted by their gene symbols. Red crosses indicate that the according samples belong to the minor condition. At the right hand side of the heatmap, each gene is annotated by the minimum (‘>’), the median of two conditions (‘m1’ and ‘m2’) and the maximum (‘<’) read count.

References

    1. Mortazavi A, Williams BA, McCue K, Schaeffer L, Wold B. Mapping and quantifying mammalian transcriptomes by RNA-seq. Nat. Methods. 2008;5:621–628. - PubMed
    1. Wang Z, Gerstein M, Snyder M. RNA-seq: a revolutionary tool for transcriptomics. Nat. Rev. Genet. 2009;10:57–63. - PMC - PubMed
    1. Trapnell C, Williams BA, Pertea G, Mortazavi A, Kwan G, van Baren MJ, Salzberg SL, Wold BJ, Pachter L. Transcript assembly and quantification by RNA-seq reveals unannotated transcripts and isoform switching during cell differentiation. Nat. Biotechnol. 2010;28:511–515. - PMC - PubMed
    1. Nagalakshmi U, Wang Z, Waern K, Shou C, Raha D, Gerstein M, Snyder M. The transcriptional landscape of the yeast genome defined by RNA sequencing. Science. 2008;320:1344–1349. - PMC - PubMed
    1. Sultan M, Schulz MH, Richard H, Magen A, Klingenhoff A, Scherf M, Seifert M, Borodina T, Soldatov A, Parkhomchuk D, et al. A global view of gene activity and alternative splicing by deep sequencing of the human transcriptome. Science. 2008;321:956–960. - PubMed

Publication types