. 2013 Nov 15;305(10):F1477-90.
doi: 10.1152/ajprenal.00182.2013. Epub 2013 Sep 18.

TGF-β1 stimulates mitochondrial oxidative phosphorylation and generation of reactive oxygen species in cultured mouse podocytes, mediated in part by the mTOR pathway

Affiliations

TGF-β1 stimulates mitochondrial oxidative phosphorylation and generation of reactive oxygen species in cultured mouse podocytes, mediated in part by the mTOR pathway

Yoshifusa Abe et al. Am J Physiol Renal Physiol. .

Abstract

Transforming growth factor (TGF)-β has been associated with podocyte injury; we have examined its effect on podocyte bioenergetics. We studied transformed mouse podocytes, exposed to TGF-β1, using a label-free assay system, Seahorse XF24, which measures oxygen consumption rates (OCR) and extracellular acidification rates (ECAR). Both basal OCR and ATP generation-coupled OCR were significantly higher in podocytes exposed to 0.3-10 ng/ml of TGF-β1 for 24, 48, and 72 h. TGF-β1 (3 ng/ml) increased oxidative capacity 75%, and 96% relative to control after 48 and 72 h, respectively. ATP content was increased 19% and 30% relative to control after a 48- and 72-h exposure, respectively. Under conditions of maximal mitochondrial function, TGF-β1 increased palmitate-driven OCR by 49%. Thus, TGF-β1 increases mitochondrial oxygen consumption and ATP generation in the presence of diverse energy substrates. TGF-β1 did not increase cell number or mitochondrial DNA copy number but did increase mitochondrial membrane potential (MMP), which could explain the OCR increase. Reactive oxygen species (ROS) increased by 32% after TGF-β1 exposure for 48 h. TGF-β activated the mammalian target of rapamycin (mTOR) pathway, and rapamycin reduced the TGF-β1-stimulated increases in OCR, ECAR, ATP generation, cellular metabolic activity, and protein generation. Our data suggest that TGF-β1, acting, in part, via mTOR, increases mitochondrial MMP and OCR, resulting in increased ROS generation and that this may contribute to podocyte injury.

Keywords: TGF-β1; bioenergetics; extracellular acidification rate; mitochondria; oxygen consumption rate; podocyte.


Figures

Fig. 1.
Fig. 1.
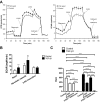
TGF-β1 effect on oxygen consumption, oxidative capacity, and extracellular acidification rate. A: oxygen consumption rate (OCR; left axis) in transformed podocytes. Basal OCR and coupled OCR to ATP generation were significantly higher in podocytes exposed to 0.3 to 10 ng/ml of TGF-β1 for 24, 48, and 72 h (P < 0.01–0.001, by one-way ANOVA). Each data point represents the average of four rates ± SD; n = 4 wells. After the injection of carbonylcyanide-[-trifluoromethoxy phenyl (FCCP), OCR was highest in podocytes exposed to TGF-β1, 3 ng/ml, for 48 h (P <0.001 vs. vehicle control, by one-way ANOVA). Each data point represents mean of the average of the last three rates ± SD; n = 4 wells. *P < 0.05 vs. vehicle control. **P < 0.01 vs. vehicle control. ***P < 0.001 vs. vehicle control. The concentrations of oligomycin and FCCP were 1 μM and 3 μM, respectively. B: representative data from single Seahorse experiment, representative of five similar experiments, depicting OCR (left) and extracellular acidification rate (ECAR; right) in transformed podocytes exposed to TGF-β1, 3 ng/ml, for 48 h. Each data point in OCR represents means ± SE; n = 10 wells in each group. Each data point in ECAR represents means ± SE; n = 9–10 wells in control cells and n = 10 wells in TGF-β1-exposed cells. The concentrations of oligomycin, FCCP, and antimycin were 1 μM, 3 μM, and 1 μM, respectively. TGF-β1 increases basal and FCCP-stimulated (uncoupled) OCR and ECAR. C: total OCR and total ECAR, as well the fractions of OCR and ECAR that were changed following administration of oligomycin (complex V inhibitor), FCCP (uncoupler of mitochondrial respiration and ATP synthesis), and antimycin (complex III inhibitor). Data are derived from the experiment presented in B. TGF-β1 increased basal OCR, coupled OCR to ATP generation, oxidative capacity, and to a lesser degree, antimycin-sensitive OCR; these data suggest that TGF-β1 stimulated both mitochondrial respiration and, to a lesser degree, nonmitochondrial oxygen consumption. Each column represents means ± SD; n = 9–10 wells in control cells and n = 10 wells in TGF-β1-treated cells. Average rates were determined at 2–4 time points (shown as solid circles in B). Basal OCR and ECAR are the average rates of four time points. Coupled OCR to ATP turnover, which is oligomycin-sensitive OCR, is the average of four rates. Oxidative capacity, which is FCCP-enhanced OCR, is the average of the last three of six rates. Antimycin-insensitive OCR (nonmitochondrial respiration) is the average of four rates. Oligomycin-sensitive ECAR is the average of the last two of four rates subtracted by the average basal rate. FCCP-sensitive ECAR is the average of the last three of six rates subtracted by the average of the last two rates prior to the FCCP injection. Antimycin-insensitive ECAR is the average of four rates subtracted by the average basal rate. **P < 0.01 vs. vehicle control. ***P < 0.001 vs. vehicle control. D: similar data as those in B, for primary podocytes. Each data point represents means ± SE; n = 8–10 in control cells and n = 10 in TGF-β1-exposed cells. The concentrations of oligomycin, FCCP, and antimycin were 1 μM, 3 μM, and 1 μM, respectively. The results are representative of two independent experiments. E: total OCR and total ECAR, as well the fractions of OCR and ECAR that were changed following administration of oligomycin, FCCP, and antimycin. Data are derived from the experiment presented in D. Each column represents mean ± SD; n = 8–10 in control cells and n = 10 in TGF-β1-exposed cells. The rates were as described in C. ***P < 0.001 vs. vehicle control. The results were generally similar to those from transformed podocytes.
Fig. 2.
Fig. 2.
TGF-β1 effect on glycolysis. A: OCR (left) and the ECAR (right) in transformed podocytes exposed to 3 ng/ml of TGF-β1 for 48 h. Each data point represents mean ± SE; n = 10 in each group. The concentrations of oligomycin, FCCP, 2-deoxyglucose (2-DG), and antimycin were 1 μM, 3 μM, 100 mM, and 1 μM, respectively. B: ECAR component in transformed podocytes exposed to 3 ng/ml of TGF-β1 for 48 h. Each bar represents mean ± SD; n = 10 in each group. Basal ECAR is the average of four rates. Glycolytic capacity, which is FCCP-enhanced ECAR subtracted by the ECAR decreased by 2-DG (the average of last two of four rates), is the average of last three of six rates. 2-DG-insensitive ECAR is the average of two rates before the injection of antimycin and rotenone subtracted by the average of the bottom two of four rates in each group (***P < 0.001 compared with each control, unpaired t-test). The experiment is representative of three similar experiments. These results suggest that TGF-β increased basal and mitochondrially inhibited glycolytic activity, and the latter was entirely 2-DG sensitive, confirming the specificity for the glycolytic pathway. C: intracellular ATP level was measured in response to 3 ng/ml of TGF-β1 for 48 h. The concentrations of 2-DG and rotenone were 100 mM and 1 μM, respectively. Each data point represents means ± SD; n = 5. The result is representative of two similar experiments. ****P < 0.0001, Bonferroni's multiple comparison test.
Fig. 3.
Fig. 3.
TGF-β1 effect on intracellular ATP levels, cell numbers/viability, and protein content. A: intracellular ATP level was measured in response to TGF-β1, at 0.1, 0.3, 1, 3, and 10 ng/ml (in all panels). The ATP level was expressed as a percentage of control, which was defined as the baseline value in cells exposed only to vehicle. Each data point represents means ± SD; n = 4. Although there were no significant differences after 24-h exposure of TGF-β1, ATP content significantly increased after 48 and 72 h exposure of TGF-β1. *P < 0.05, **P < 0.01, and ***P < 0.001 in this and subsequent panels. B: for the MTT assay, absorbance was measured in response to TGF-β. Results are expressed as percent of control, which was defined as the baseline value in cells exposed only to vehicle. Each data point represents mean ± SD (n = 4), and the results are representative of at least three independent experiments. TGF-β increased MTT absorbance, a marker of cell number and cellular metabolic activity. C: caspase activity in podocytes was measured in response to TGF-β. The value was expressed as a percentage of control, which was defined as the baseline value in cells exposed only to vehicle. Each data point represents mean ± SD; n = 4. The results are representative of two independent experiments. TGF-β increased proapoptotic caspase activity. D: calcein AM stain was performed in response to TGF-β. Each data point represents mean ± SD (n = 4). The results are representative of three independent experiments. TGF-β did not alter cell number. E: total amount of protein was increased in transformed podocytes exposed to TGF-β1 for 48 h (*P < 0.05 vs. vehicle control, by unpaired t-test). Each data represent mean ± SD; n = 4. The result is representative of two similar experiments.
Fig. 4.
Fig. 4.
TGF-β1 effect on fatty acid oxidation. A: sodium palmitate (200 μM) conjugated to ultra-fatty acid-free BSA was administered by injection into the assay medium at the time point shown. Oligomycin (1 μM), FCCP (10 μM), antimycin (1 μM), and rotenone (1 μM) were injected at the subsequent time points as shown. Basal OCR was higher in podocytes exposed to TGF-β1 compared with control. In the presence of FCCP, palmitate increased OCR and ECAR in podocytes treated with and without 3 ng/ml of TGF-β1, while palmitate showed an artifact on ECAR right after the injection. Each data point represents the mean of 4–6 rates ± SE; n = 3–5. The experiment is representative of three similar experiments. B: OCR component (absolute values in left panel and relative values in right panel) in transformed podocytes exposed to 3 ng/ml of TGF-β1 for 48 h. Each data point represents the mean of average of the last two rates ± SD; n = 4. TGF-β1 increased absolute values in basal rate, mitochondrial respiration, ATP generation, and β oxidation. ***P < 0.001 vs. vehicle control by unpaired t-test.
Fig. 5.
Fig. 5.
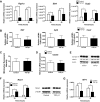
TGF-β1 effect on mRNA expression for Sirt1, Pgc1a, Ucp2, Cox5a, Nox4, and WT1 and mitochondrial DNA and protein expression. A: regulators of mitochondrial function. Transformed podocytes were exposed to 3 ng/ml of TGF-β1 for 24–48 h (*P < 0.05, **P < 0.01, and ***P < 0.001 by unpaired t-test). Gene expression values were normalized to β actin gene expression. Each data represent mean ± SD; n = 3. B: mitochondrial DNA gene expression. Transformed podocytes were exposed to 3 ng/ml of TGF-β1 for 48 h (no significant differences, by unpaired t-test). Gene expression values were normalized to hemoglobin intron gene expression. Each data represent mean ± SD; n = 3. The result is representative of three similar experiments. C: TGF-β1 effect on mitochondrial mass. Transformed podocytes were exposed to 3 ng/ml of TGF-β1 for 48 h. In the presence of the MitoTracker Green probe, fluorescent intensity was not changed after 48-h exposure to TGF-β1 (no significant differences, by unpaired t-test). Each data point represents mean ± SD; n = 12. The result is representative of two similar experiments. D: transformed podocytes were exposed to 3 ng/ml of TGF-β1 for 48 h (no significant differences, by unpaired t-test). Gene expression values were normalized to β-actin gene expression. Each data point represents mean ± SD; n = 3. The result is representative of two similar experiments. E: protein expressions of complex IV subunit I protein and VDAC1. Transformed podocytes were exposed to 3 ng/ml of TGF-β1 for 48 h. The protein was assessed by Western blot analysis. F: Left: contributors to nonmitochondrial ROS. Transformed podocytes were exposed to 3 ng/ml of TGF-β1 for 24–48 h (*P < 0.05, ***P < 0.001, by unpaired t-test). Gene expression values were normalized to β actin gene expression. Each data point represents mean ± SD; n = 3. Right: Western blotting analysis for Nox4. Transformed podocytes were exposed to 3 ng/ml of TGF-β1 for 48 h. G: TGF-β1 effect on podocyte marker. Transformed podocytes were exposed to 3 ng/ml of TGF-β1 for 24–48 h (**P < 0.01, by unpaired t-test). Gene expression values were normalized to β-actin gene expression. Each data point represents means ± SD; n = 3.
Fig. 6.
Fig. 6.
TGF-β1 effect on ROS generation and mitochondrial membrane potential (MMP). A: fluorescence of 2′,7′-dichlorodihydrofluorescein (DCF) was increased in transformed podocytes exposed to TGF-β1 for 48 h (**P < 0.01 vs. vehicle control; Dunnett's multiple comparison test). Each data represent means ± SD; n = 8. The result is representative of five similar experiments. B: fluorescence of DCF was increased in primary podocytes exposed to 3 ng/ml of TGF-β1 for 48 h (***P < 0.001, by unpaired t-test). Each data point represents mean ± SD; n = 12. C: rotenone effect on ROS generation. The fluorescence of DCF was significantly increased in transformed podocytes exposed to TGF-β1 for 48 h compared with vehicle control. Rotenone inhibited the TGF-β1-stimulated increases (**P < 0.01, ***P < 0.001, and ****P < 0.0001, by Bonferroni's multiple comparison test). Each data point represents mean ± SD; n = 4. The result is representative of two similar experiments. D: apocynin effect on ROS generation. The fluorescence of DCF was significantly low in control cells compared with cells exposed to TGF-β1 for 48 h (***P < 0.001, by Dunnett's multiple comparison test). Apocynin (1 to 1,000 μM) had no significant effect on TGF-β1-stimulated increases (by Dunnett's multiple comparison test). Each data point represents mean ± SD; n = 6. The result is representative of two similar experiments. E: MMP was measured with JC-1 in response to TGF-β, at 0.1, 0.3, 1, 3, and 10 ng/ml. Each data point represents means ± SD; n = 8. The results are representative of three independent experiments (***P < 0.001, by Dunnett's multiple-comparison test). TGF-β increased MMP. F: MMP was measured with TMRM in response to 3 ng/ml of TGF-β 48 h. Each data point represents mean ± SD; n = 16. The results are representative of two independent experiments (****P < 0.0001, by unpaired t-test). TGF-β increased MMP.
Fig. 7.
Fig. 7.
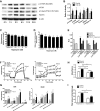
TGF-β1 effect on mTOR pathway. A: transformed mouse podocytes were exposed to TGF-β1 (3 ng/ml) for up to 24 h, and Western blots were performed on cell layers for p-mTOR, mTOR, p-tuberin, tuberin, and β actin. As shown, p-mTOR and p-tuberin were upregulated, peaking at 3 h. Loading control was β-actin. B: densitometric analysis was performed using triplicate samples. We focused on the time point 4 h after adding TGF-β1. TGF-β1 increased p-mTOR, mTOR, p-tuberin, and tuberin protein expressions without increased mitochondrial protein expressions (VDAC1 and complex IV). *P < 0.05, **P < 0.01. C: cell viability of transformed podocytes exposed to 0.1–50 nM of rapamycin for 24 h assessed by calcein AM stain. 0.1 nM and 0.5 nM rapamycin did not change cell viability. Each data point represents mean ± SD; n = 4. **P < 0.01 and ***P < 0.001 by Dunnett's multiple comparison test. The experiment is representative of two independent experiments. D: mitochondrial membrane potential (MMP) in transformed podocytes exposed to 0.1–50 nM of rapamycin for 24 h. Each data point represents mean ± SD; n = 8. *P < 0.05, **P < 0.01, and ***P < 0.001 by Dunnett's multiple comparison test. E: Rapamycin effect on ATP contents. Intracellular ATP level was measured in transformed podocytes exposed to 0.5 nM of rapamycin for 24 h prior to the addition of 3 ng/ml of TGF-β1 for 48 h. The concentrations of 2-DG and rotenone were 100 mM and 1 μM, respectively. Each data point represents mean ± SD; n = 5. ***P < 0.001, ****P < 0.0001 vs. vehicle control by one-way ANOVA. #P < 0.0001 vs. vehicle control by one-way ANOVA. F: OCR (left) and the extracellular acidification rate (ECAR, right) in transformed podocytes exposed to 0.5 nM of rapamycin for 24 h prior to addition of 3 ng/ml of TGF-β1 for 48 h. Each data point for OCR and ECAR represents mean ± SE; n = 4 or 5 wells in each group. The concentrations of oligomycin, FCCP, and antimycin were 1 μM, 3 μM, and 1 μM, respectively. The experiment is representative of three independent experiments. G: total OCR and total ECAR, as well the fractions of OCR and ECAR that were changed following sequential administration of oligomycin (complex V inhibitor), FCCP (uncoupler of mitochondrial respiration and ATP synthesis), and antimycin (complex III inhibitor). Data are derived from the experiment presented in D. Each column represents mean ± SD; n = 4 or 5 wells in each group. Average rates were determined at 2–4 time points (shown as solid circles or squares in F). Basal OCR and ECAR are the average rates of four time points. Coupled OCR to ATP generation, which is oligomycin-sensitive OCR, is the average of four rates. Oxidative capacity, which is FCCP-enhanced OCR, is the average of last three of six rates. Antimycin-insensitive OCR (nonmitochondrial respiration) is the average of four rates. Oligomycin-sensitive ECAR is the average of the last two of four rates subtracted by the average basal rate. FCCP-sensitive ECAR is the average of the last three of six rates subtracted by the average of the last two rates prior to the FCCP injection. Antimycin-insensitive ECAR is the average of four rates after subtraction of the average basal rate. **P < 0.01 vs. vehicle control. ***P < 0.001 vs. vehicle control. †P < 0.001, cells exposed to rapamycin and TGF-β1 vs. cells exposed to TGF-β1 only. The experiment is representative of three independent experiments. H: rapamycin effect on cellular metabolic activity. For MTT assay, absorbance was measured in transformed podocytes exposed to 0.5 nM of rapamycin for 24 h prior to addition of 3 ng/ml of TGF-β1 for 48 h. Each data point represents mean ± SD; n = 8. ****P < 0.0001. The experiment is representative of two independent experiments. I: rapamycin effect on total amount of protein in podocytes. Each data point represents mean ± SD; n = 3. For measuring protein amount, absorbance was measured in transformed podocytes exposed to 0.5 nM of rapamycin for 24 h prior to addition of 3 ng/ml of TGF-β1 for 48 h. **P < 0.01. ****P < 0.001.
Fig. 8.
Fig. 8.
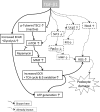
Summary of proposed pathway leading from TGF-β1 receptor binding to ROS generation. The dotted lines denote connections established in a range of cell types. The solid lines denote connections demonstrated in the present work. The protein expression of Sirt1, Pgc1a, Ucp2, and Nox4 did not change in our system. MMP, mitochondrial membrane potential; OCR, oxygen consumption rate; ROS, reactive oxygen species; TCA, tricarboxylic acid cycle; gene and protein names explained in the text. Phosphorylated TSC2 is the inactive form, which is permissive for mTOR activation.

References

    1. Abe Y, Sakairi T, Kajiyama H, Shrivastav S, Beeson C, Kopp JB. Bioenergetic characterization of mouse podocytes. Am J Physiol Cell Physiol 299: C464–C476, 2010 - PMC - PubMed
    1. Bishop T, Brand MD. Processes contributing to metabolic depression in hepatopancreas cells from the snail Helix aspersa. J Exp Biol 203: 3603–3612, 2000 - PubMed
    1. Bondi CD, Manickam N, Lee DY, Block K, Gorin Y, Abboud HE, Barnes JL. NAD(P)H oxidase mediates TGF-β1-induced activation of kidney myofibroblasts. J Am Soc Nephrol 21: 93–102 - PMC - PubMed
    1. Casalena G, Daehn I, Bottinger E. Transforming growth factor-β, bioenergetics, and mitochondria in renal disease. Semin Nephrol 32: 295–303, 2012 - PMC - PubMed
    1. Choi SW, Gerencser AA, Nicholls DG. Bioenergetic analysis of isolated cerebrocortical nerve terminals on a microgram scale: spare respiratory capacity and stochastic mitochondrial failure. J Neurochem 109: 1179–1191, 2009 - PMC - PubMed

Publication types

MeSH terms