Fluid reabsorption in proximal convoluted tubules of mice with gene deletions of claudin-2 and/or aquaporin1
- PMID: 24049145
- PMCID: PMC3840226
- DOI: 10.1152/ajprenal.00342.2013
Fluid reabsorption in proximal convoluted tubules of mice with gene deletions of claudin-2 and/or aquaporin1
Abstract
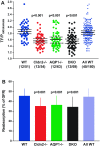
Deletions of claudin-2 (Cldn2) and aquaporin1 (AQP1) reduce proximal fluid reabsorption (PFR) by about 30% and 50%, respectively. Experiments were done to replicate these observations and to determine in AQP1/claudin-2 double knockout mice (DKO) if the effects of deletions of these established water pores are additive. PFR was determined in inactin/ketamine-anesthetized mice by free-flow micropuncture using single-nephron I(125)-iothalamate (io) clearance. Animal means of PFR [% of glomerular filtration rate (GFR)] derived from TF/Piothalamate ratios in 12 mice in each of four groups [wild type (WT), Cldn2(-/-), AQP1(-/-), and DKO) were 45.8 ± 0.85 (51 tubules), 35.4 ± 1 (54 tubules; P < 0.01 vs. WT), 36.8 ± 1 (63 tubules; P < 0.05 vs. WT), and 33.9 ± 1.4 (69 tubules; P < 0.01 vs. WT). Kidney and single-nephron GFRs (SNGFR) were significantly reduced in all mutant strains. The direct relationship between PFR and SNGFR was maintained in mutant mice, but the slope of this relationship was reduced in the absence of Cldn2 and/or AQP1. Transtubular osmotic pressure differences were not different between WT and Cldn2(-/-) mice, but markedly increased in DKO. In conclusion, the deletion of Cldn2, AQP1, or of both Cldn2 and AQP1 reduces PFR by 22.7%, 19.6%, and 26%, respectively. Our data are consistent with an up to 25% paracellular contribution to PFR. The reduced osmotic water permeability caused by absence of AQP1 augments luminal hypotonicity. Aided by a fall in filtered load, the capacity of non-AQP1-dependent transcellular reabsorption is sufficient to maintain PFR without AQP1 and claudin-2 at 75% of control.
Keywords: iothalamate; micropuncture; paracellular; transcellular; tubular fluid osmolarity.
Figures


Comment in
-
Significant water absorption goes paracellular in kidney proximal tubules.Am J Physiol Renal Physiol. 2014 Jan 1;306(1):F51-2. doi: 10.1152/ajprenal.00545.2013. Epub 2013 Oct 23. Am J Physiol Renal Physiol. 2014. PMID: 24154692 No abstract available.
Similar articles
-
Defective proximal tubular fluid reabsorption in transgenic aquaporin-1 null mice.Proc Natl Acad Sci U S A. 1998 Aug 4;95(16):9660-4. doi: 10.1073/pnas.95.16.9660. Proc Natl Acad Sci U S A. 1998. PMID: 9689137 Free PMC article.
-
Luminal hypotonicity in proximal tubules of aquaporin-1-knockout mice.Am J Physiol Renal Physiol. 2000 Jun;278(6):F1030-3. doi: 10.1152/ajprenal.2000.278.6.F1030. Am J Physiol Renal Physiol. 2000. PMID: 10836992
-
Compensation of proximal tubule malabsorption in AQP1-deficient mice without TGF-mediated reduction of GFR.Acta Physiol Scand. 2004 Aug;181(4):455-62. doi: 10.1111/j.1365-201X.2004.01318.x. Acta Physiol Scand. 2004. PMID: 15283758
-
Claudins and renal salt transport.Clin Exp Nephrol. 2012 Feb;16(1):61-7. doi: 10.1007/s10157-011-0491-4. Epub 2011 Nov 1. Clin Exp Nephrol. 2012. PMID: 22038258 Review.
-
Physiological roles of AQP7 in the kidney: Lessons from AQP7 knockout mice.Biochim Biophys Acta. 2006 Aug;1758(8):1106-10. doi: 10.1016/j.bbamem.2006.04.002. Epub 2006 Apr 20. Biochim Biophys Acta. 2006. PMID: 16860289 Review.
Cited by
-
Claudin-2-mediated cation and water transport share a common pore.Acta Physiol (Oxf). 2017 Feb;219(2):521-536. doi: 10.1111/apha.12742. Epub 2016 Jul 20. Acta Physiol (Oxf). 2017. PMID: 27359349 Free PMC article.
-
Association Study of Reported Significant Loci at 5q35.3, 7p14.3, 13q14.1 and 16p12.3 with Urolithiasis in Chinese Han Ethnicity.Sci Rep. 2017 Mar 31;7:45766. doi: 10.1038/srep45766. Sci Rep. 2017. PMID: 28361944 Free PMC article.
-
Regulation of glomerulotubular balance. IV. Implication of aquaporin 1 in flow-dependent proximal tubule transport and cell volume.Am J Physiol Renal Physiol. 2022 Dec 1;323(6):F642-F653. doi: 10.1152/ajprenal.00167.2022. Epub 2022 Sep 15. Am J Physiol Renal Physiol. 2022. PMID: 36108052 Free PMC article.
-
SIRT2 Regulates LPS-Induced Renal Tubular CXCL2 and CCL2 Expression.J Am Soc Nephrol. 2015 Jul;26(7):1549-60. doi: 10.1681/ASN.2014030226. Epub 2014 Oct 27. J Am Soc Nephrol. 2015. PMID: 25349202 Free PMC article.
-
Claudin-2 suppresses GEF-H1, RHOA, and MRTF, thereby impacting proliferation and profibrotic phenotype of tubular cells.J Biol Chem. 2019 Oct 18;294(42):15446-15465. doi: 10.1074/jbc.RA118.006484. Epub 2019 Sep 3. J Biol Chem. 2019. PMID: 31481470 Free PMC article.
References
-
- Amasheh S, Meiri N, Gitter AH, Schoneberg T, Mankertz J, Schulzke JD, Fromm M. Claudin-2 expression induces cation-selective channels in tight junctions of epithelial cells. J Cell Sci 115: 4969–4976, 2002 - PubMed
-
- Andreoli TE, Schafer JA. Volume absorption in the pars recta. III. Luminal hypotonicity as a driving force for isotonic volume absorption. Am J Physiol Renal Fluid Electrolyte Physiol 234: F349–F355, 1978 - PubMed
-
- Barfuss DW, Schafer JA. Hyperosmolality of absorbate from isolated rabbit proximal tubules. Am J Physiol Renal Fluid Electrolyte Physiol 247: F130–F139, 1984 - PubMed
-
- Berry CA. Water permeability and pathways in the proximal tubule. Am J Physiol Renal Fluid Electrolyte Physiol 245: F279–F294, 1983 - PubMed
-
- Bomsztyk K, Wright FS. Dependence of ion fluxes on fluid transport by rat proximal tubule. Am J Physiol Renal Fluid Electrolyte Physiol 250: F680–F689, 1986 - PubMed
Publication types
MeSH terms
Substances
Grants and funding
LinkOut - more resources
Full Text Sources
Other Literature Sources
Molecular Biology Databases
Miscellaneous

