. 2013 Dec;87(23):12794-804.
doi: 10.1128/JVI.01160-13. Epub 2013 Sep 18.

Yellow fever vaccination elicits broad functional CD4+ T cell responses that recognize structural and nonstructural proteins

Affiliations

Yellow fever vaccination elicits broad functional CD4+ T cell responses that recognize structural and nonstructural proteins

Eddie A James et al. J Virol. 2013 Dec.

Abstract

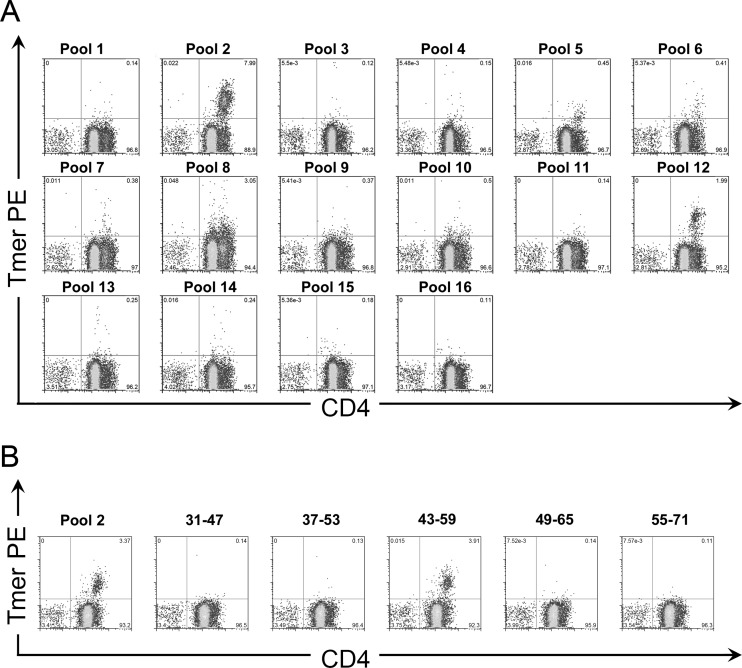
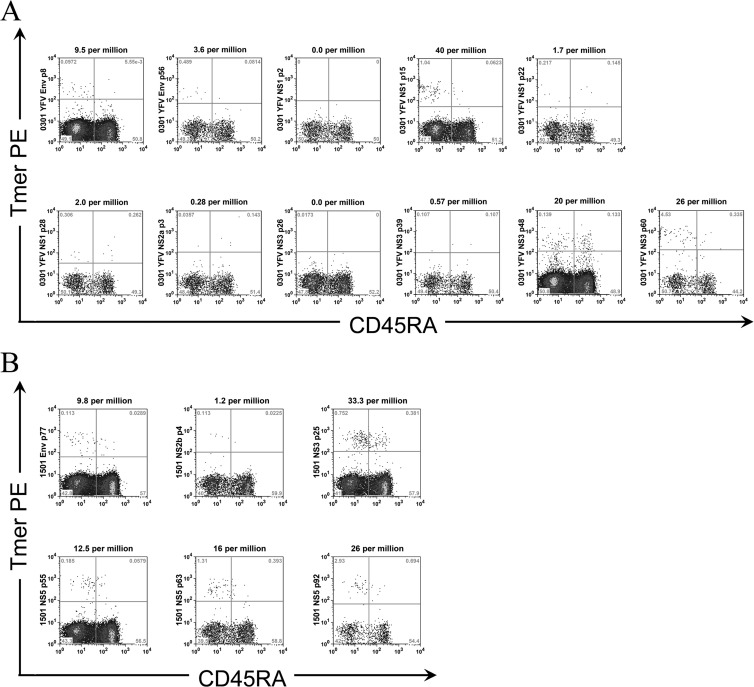
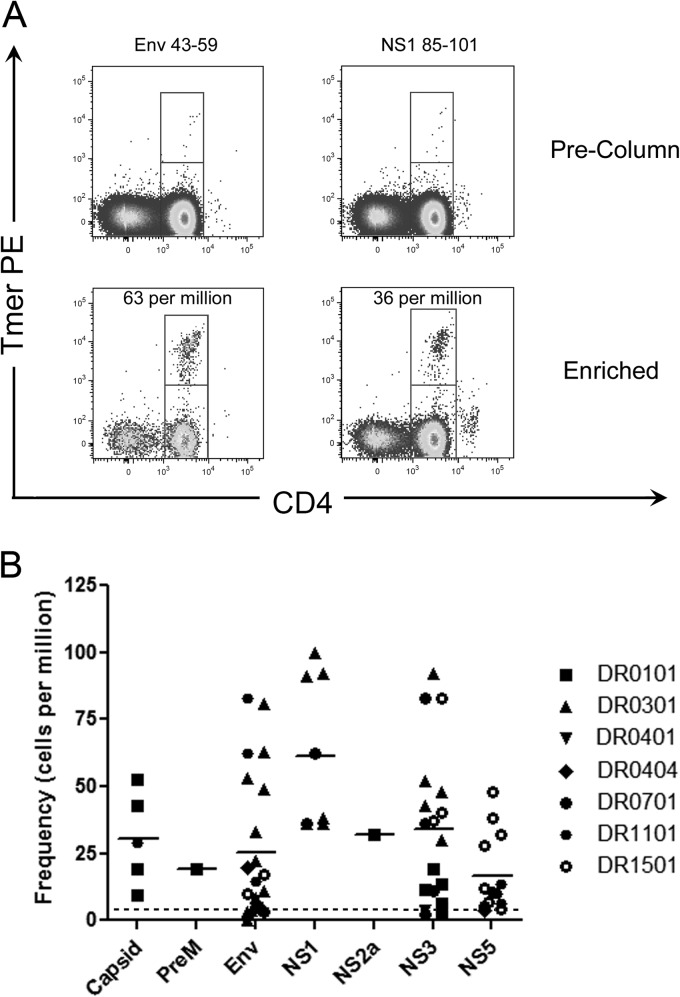
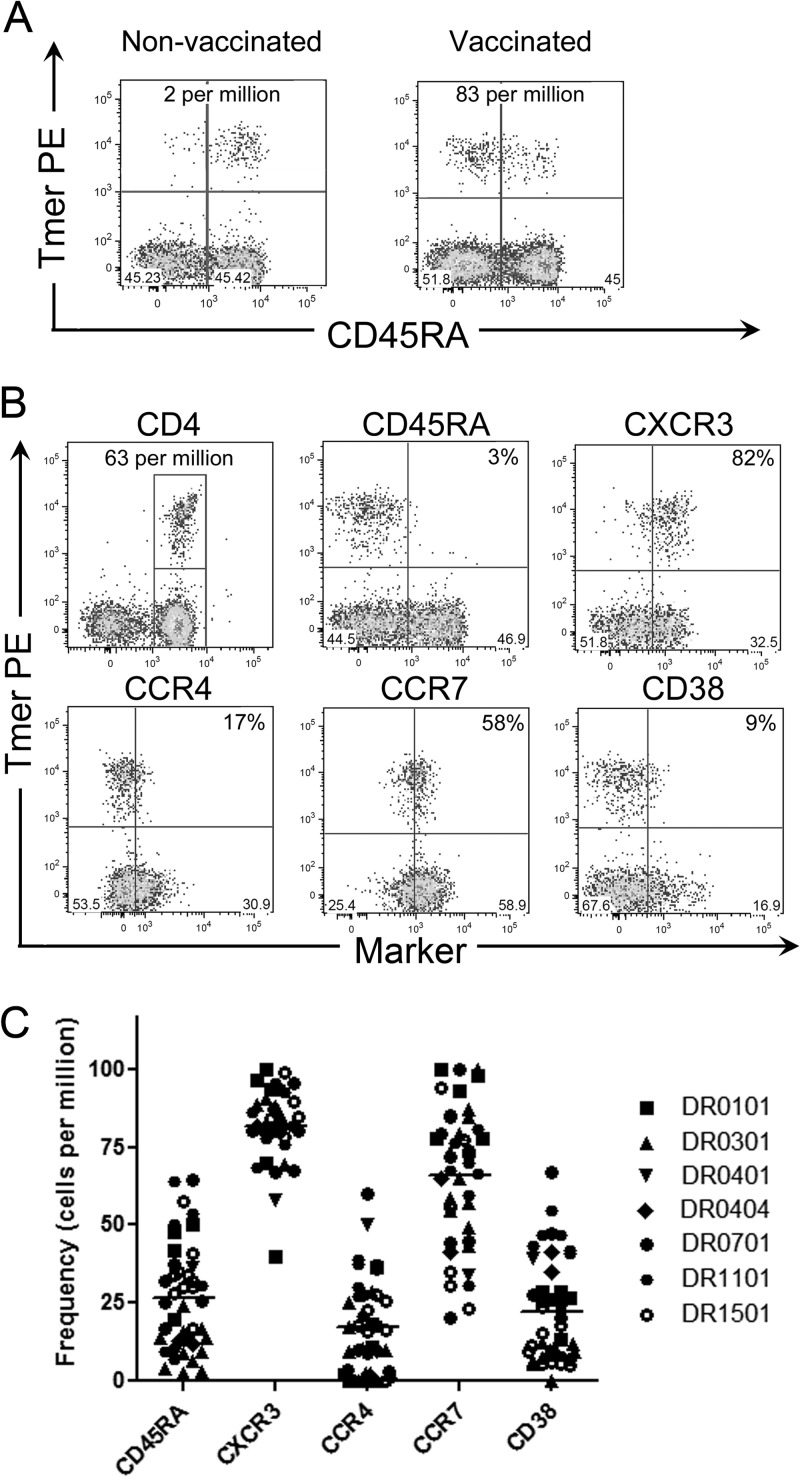
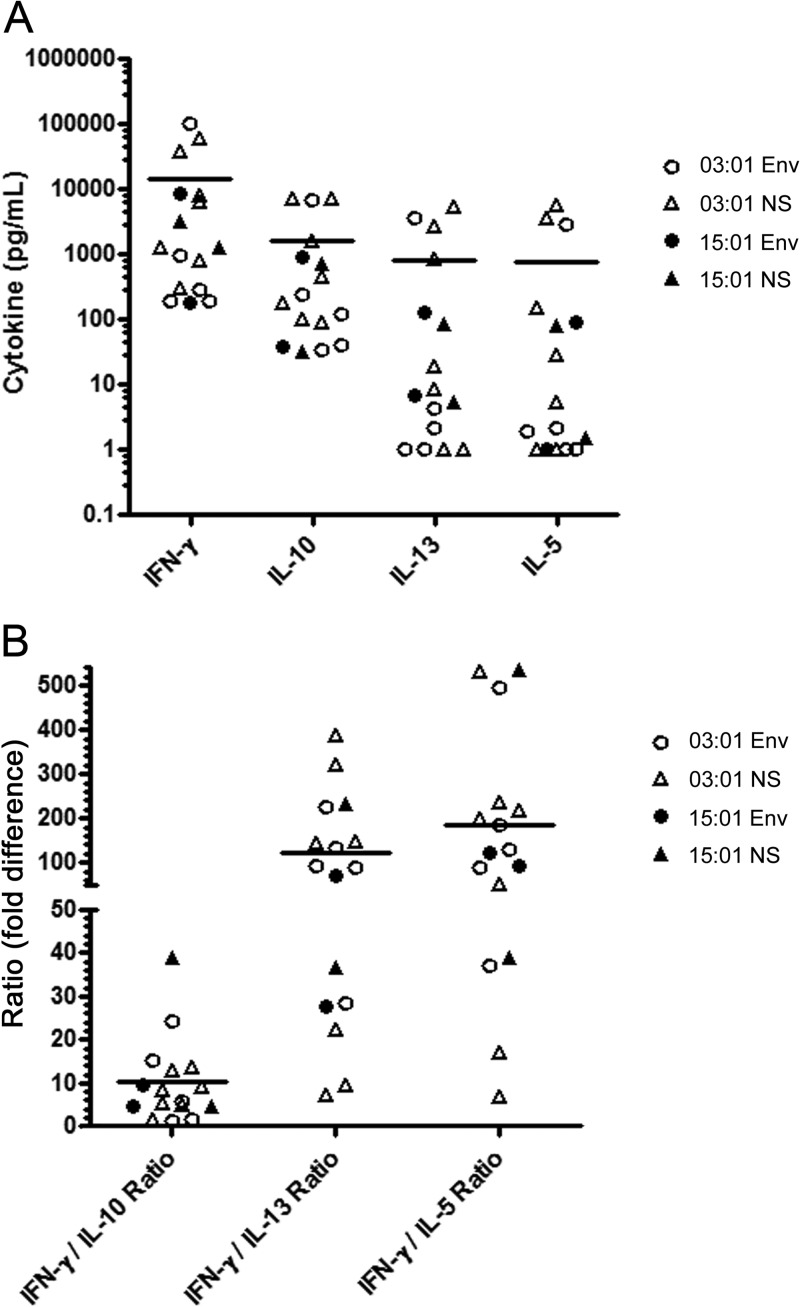
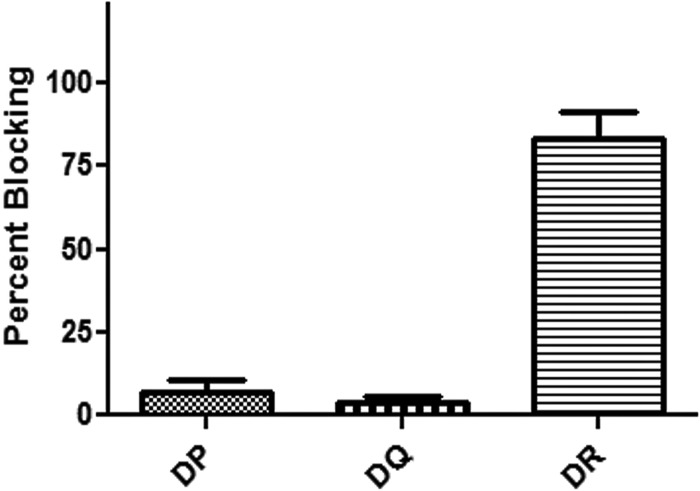
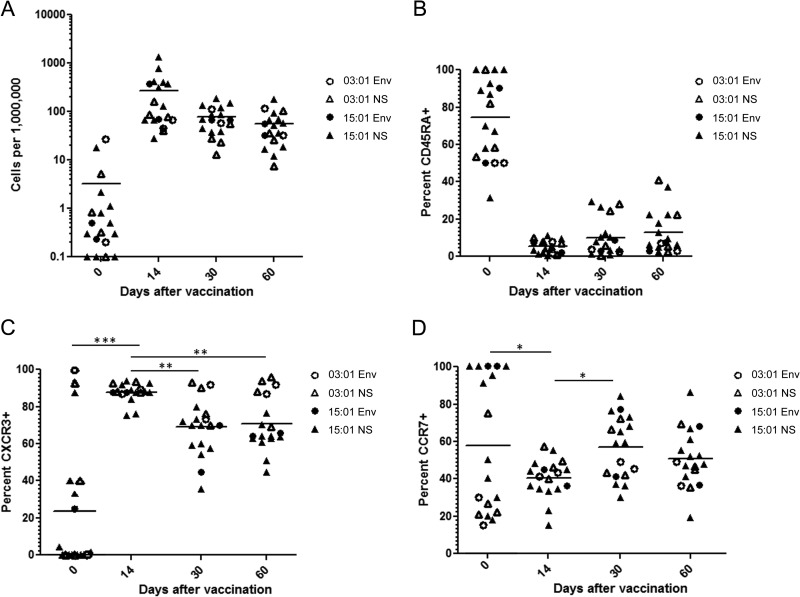
Yellow fever virus (YFV) can induce acute, life-threatening disease that is a significant health burden in areas where yellow fever is endemic, but it is preventable through vaccination. The live attenuated 17D YFV strain induces responses characterized by neutralizing antibodies and strong T cell responses. This vaccine provides an excellent model for studying human immunity. While several studies have characterized YFV-specific antibody and CD8(+) T cell responses, less is known about YFV-specific CD4(+) T cells. Here we characterize the epitope specificity, functional attributes, and dynamics of YFV-specific T cell responses in vaccinated subjects by investigating peripheral blood mononuclear cells by using HLA-DR tetramers. A total of 112 epitopes restricted by seven common HLA-DRB1 alleles were identified. Epitopes were present within all YFV proteins, but the capsid, envelope, NS2a, and NS3 proteins had the highest epitope density. Antibody blocking demonstrated that the majority of YFV-specific T cells were HLA-DR restricted. Therefore, CD4(+) T cell responses could be effectively characterized with HLA-DR tetramers. Ex vivo tetramer analysis revealed that YFV-specific T cells persisted at frequencies ranging from 0 to 100 cells per million that are detectable years after vaccination. Longitudinal analysis indicated that YFV-specific CD4(+) T cells reached peak frequencies, often exceeding 250 cells per million, approximately 2 weeks after vaccination. As frequencies subsequently declined, YFV-specific cells regained CCR7 expression, indicating a shift from effector to central memory. Cells were typically CXCR3 positive, suggesting Th1 polarization, and produced gamma interferon and other cytokines after reactivation in vitro. Therefore, YFV elicits robust early effector CD4(+) T cell responses that contract, forming a detectable memory population.


Figures

Fig 1
Fig 1
Identification of CD4+ T cell epitopes within YFV proteins. (A) Staining of in vitro-stimulated cells from an HLA-DRB1*03:01 vaccinee with tetramers (Tmer) loaded with peptide pools spanning the YFV envelope protein. Peptide pools 2 and 12 contained DRB1*03:01-restricted epitopes. (B) Identification of the antigenic peptide within envelope pool 2 by staining of in vitro-stimulated cells with tetramers loaded with single peptides. The pool 2 epitope was identified within the Env 43-59 peptide.
Fig 2
Fig 2
Selection of YFV epitopes for ex vivo analysis. (A) Frequencies of YFV-specific T cells in a vaccinated DRB1*03:01 subject. The frequencies of T cells per million CD4+ T cells are as indicated. Env p8 (43-59), Env p56 (331-347), NS1 p15 (85-101), and NS3 p60 (355-371) effectively labeled YFV-specific CD4+ T cells. NS3 p48 (283-299) had a high background, while NS1 p2 (7-23), NS1 p22 (127-143), NS1 p28 (163-179), NS2a p3 (13-29), NS3 p26 (151-167), and NS3 p39 (229-245) did not label a distinct population. (B) Frequencies of YFV-specific T cells per million CD4+ T cells in a vaccinated DRB1*15:01 subject. Env p77 (457-473), NS3 p25 (145-161), NS5 p55 (325-341), NS5 p63 (367-383), and NS5 p92 (547-563) effectively labeled YFV-specific CD4+ T cells, while NS2b p4 (19-35) did not label a distinct population.
Fig 3
Fig 3
Frequencies of YFV-specific T cells. (A) Frequencies of YFV-specific T cells in a vaccinated DRB1*03:01 subject. The frequencies of T cells per million CD4+ T cells are as indicated. (B) Frequencies of YFV-specific T cells in 16 vaccinated subjects with DRB1*01:01, DRB1*03:01, DRB1*04:01, DRB1*04:04, DRB1*07:01, DRB1*11:01, or DRB1*15:01 HLA-DR haplotypes. Each data point represents the frequency of T cells specific for a single YFV protein epitope in a single subject. The dotted reference line indicates the average number of CD45RA T cells from naive, unvaccinated subjects.
Fig 4
Fig 4
Phenotype of YFV-specific T cells. (A) Ex vivo analysis of 80 million PBMCs from an unvaccinated DRB1*15:01 subject (left) and 20 million PBMCs from a YF-vaccinated DRB1*15:01 subject (right) stained with PE-labeled NS3 145-161 tetramer (Tmer) and CD45RA antibody. The frequencies of T cells per million CD4+ T cells are indicated. (B) Ex vivo analysis of a representative vaccinated DRB1*03:01 subject stained with PE-labeled Env 43-59 tetramer and CD45RA, CXCR3, CCR4, CCR7, and CD38 antibodies. The value in the upper right quadrant of each panel is the percentage of epitope-specific cells that express that marker. (C) Summary of ex vivo T cell phenotypes for vaccinated subjects with DRB1*01:01, DRB1*03:01, DRB1*04:01, DRB1*04:04, DRB1*07:01, DRB1*11:01, or DRB1*15:01 HLA-DR haplotypes. T cells specific for single YFV protein epitopes were stained with PE-labeled tetramers and CD45RA, CXCR3, CCR4, CCR7, and CD38 antibodies. Each data point represents the expression of the corresponding surface marker by T cells from a single vaccinated subject.
Fig 5
Fig 5
Cytokine analysis of supernatants from YFV-specific T cell lines. (A) Supernatants from a total of 16 peptide/MHC-activated YFV-specific T cell lines specific for epitopes from the envelope protein or nonstructural proteins isolated from vaccinated subjects with a DRB1*15:01 or a DRB1*03:01 haplotype were analyzed for IFN-γ, IL-10, IL-13, and IL-5 content with the MSD Cytokine Multiplex kit. Each symbol indicates the level of secreted cytokine for a single cell line. The y axis uses a logarithmic scale to depict the wide range of cytokine levels observed (0 to 100,000 pg/ml). (B) Cytokine ratios for IFN-γ production versus IL-10, IL-13, and IL-5 production by the same 16 T cell lines specific for epitopes from the envelope protein (circles) or nonstructural proteins isolated from vaccinated subjects with a DRB1*15:01 or a DRB1*03:01 haplotype. Each symbol indicates the ratio of secreted cytokines for a single cell line.
Fig 6
Fig 6
HLA blocking of YFV-specific CD4+ T cell responses. Each bar indicates the average percent blocking observed after the addition of HLA-DP-, HLA-DQ-, or HLA-DR-blocking antibodies (triplicate SFCs enumerated by ELISPOT assay compared with an unblocked control) measured in 10 different vaccinated subjects (error bars indicated SEM).
Fig 7
Fig 7
Longitudinal changes in the frequency and phenotype of YFV-specific CD4+ T cells. (A) Ex vivo frequencies of YFV-specific T cells in six vaccinated subjects with a DRB1*15:01 or a DRB1*03:01 haplotype measured before and 14, 30, and 60 days after vaccination with two to four different tetramers loaded with epitopes from the envelope (Env) protein or nonstructural (NS) proteins. Each data point represents the frequency of T cells specific for a single YFV epitope in a single subject. (B) Changes in cell surface expression of CD45RA for YFV-specific T cells in the same six vaccinated subjects measured before and 14, 30, and 60 days after vaccination with tetramers corresponding to the same epitopes. (C) Changes in cell surface expression of CXCR3 for YFV-specific T cells in the same six vaccinated subjects measured before and 14, 30, and 60 days after vaccination. CXCR3 expression was significantly increased 14 days following vaccination (P < 0.05) and subsequently declined (P < 0.05). (D) Changes in cell surface expression of CCR7 for YFV-specific T cells in the same six vaccinated subjects measured before and 14, 30, and 60 days after vaccination. CCR7 expression was significantly decreased 14 days following vaccination (P < 0.05) but recovered by 30 days following vaccination (P < 0.05).

References

    1. Barrett AD, Higgs S. 2007. Yellow fever: a disease that has yet to be conquered. Annu. Rev. Entomol. 52:209–229 - PubMed
    1. Monath TP. 2005. Yellow fever vaccine. Expert Rev. Vaccines 4:553–574 - PubMed
    1. Monath TP. 2012. Review of the risks and benefits of yellow fever vaccination including some new analyses. Expert Rev. Vaccines 11:427–448 - PubMed
    1. Theiler M, Smith HH. 1937. The use of yellow fever virus modified by in vitro cultivation for human immunization. J. Exp. Med. 65:787–800 - PMC - PubMed
    1. Poland JD, Calisher CH, Monath TP, Downs WG, Murphy K. 1981. Persistence of neutralizing antibody 30-35 years after immunization with 17D yellow fever vaccine. Bull. World Health Organ. 59:895–900 - PMC - PubMed

Publication types

MeSH terms