. 2013 Apr;2(4):1.
doi: 10.1167/tvst.2.4.1. Epub 2013 Apr 12.

Factors Affecting Perceptual Threshold in Argus II Retinal Prosthesis Subjects

Affiliations

Factors Affecting Perceptual Threshold in Argus II Retinal Prosthesis Subjects

A K Ahuja et al. Transl Vis Sci Technol. 2013 Apr.

Abstract

Purpose: The Argus II epiretinal prosthesis has been developed to provide partial restoration of vision to subjects blinded from outer retinal degenerative disease. Participants were surgically implanted with the system in the United States and Europe in a single arm, prospective, multicenter clinical trial. The purpose of this investigation was to determine which factors affect electrical thresholds in order to inform surgical placement of the device.

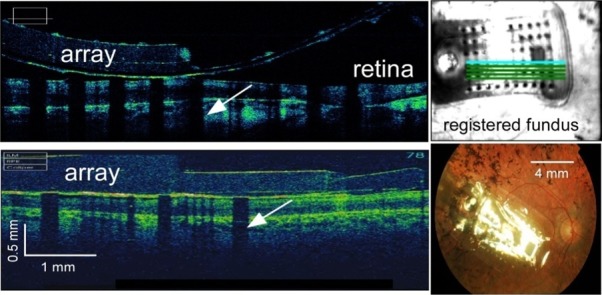
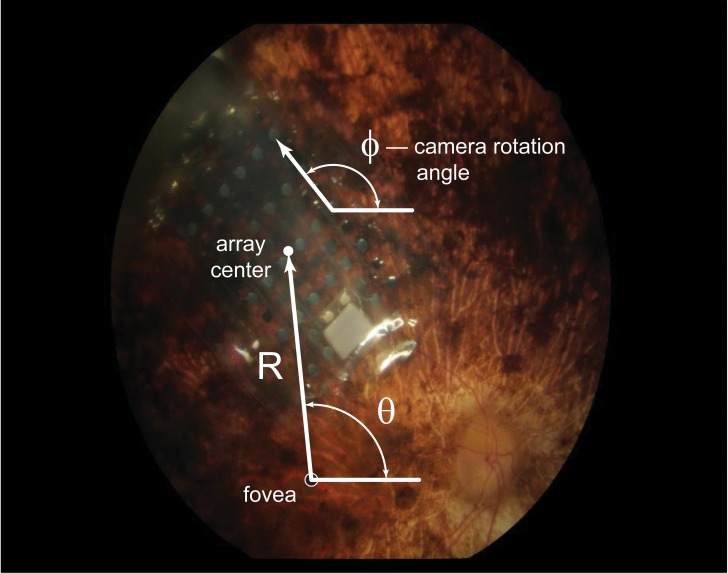
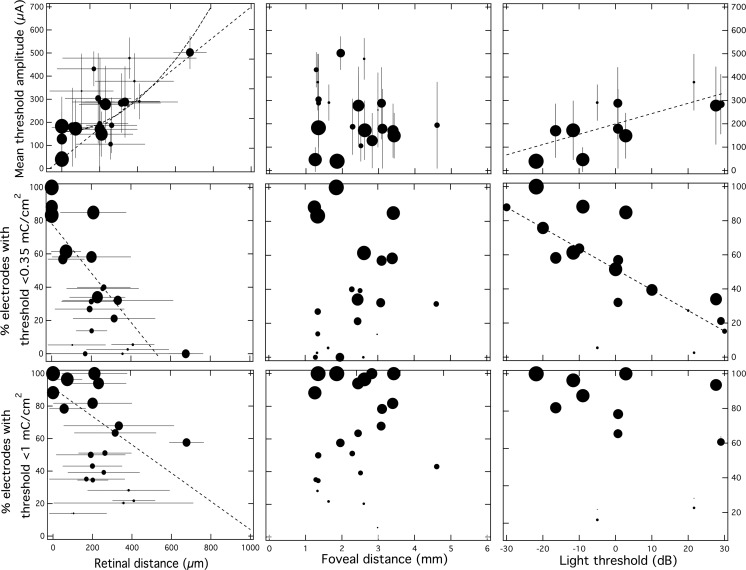
Methods: Electrode-retina and electrode-fovea distances were determined using SD-OCT and fundus photography, respectively. Perceptual threshold to electrical stimulation of electrodes was measured using custom developed software, in which current amplitude was varied until the threshold was found. Full field stimulus light threshold was measured using the Espion D-FST test. Relationships between electrical threshold and these three explanatory variables (electrode-retina distance, electrode-fovea distance, and monocular light threshold) were quantified using regression.

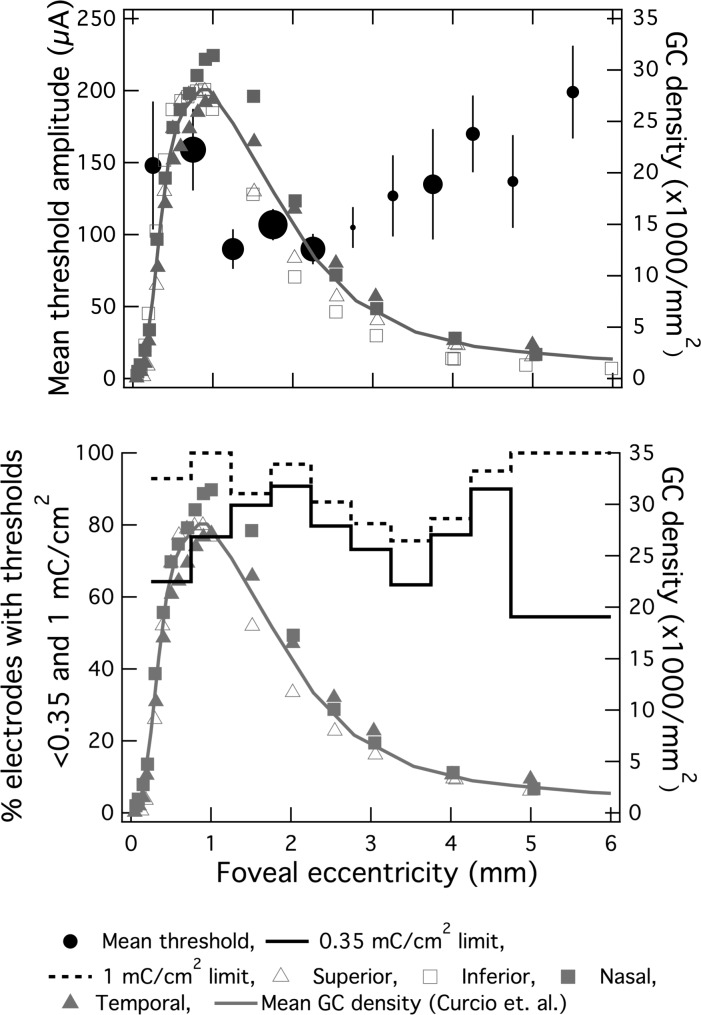
Results: Regression analysis showed a significant correlation between electrical threshold and electrode-retina distance (R2 = 0.50, P = 0.0002; n = 703 electrodes). 90.3% of electrodes in contact with the macula (n = 207) elicited percepts at charge densities less than 1 mC/cm2/phase. These threshold data also correlated well with ganglion cell density profile (P = 0.03). A weaker, but still significant, inverse correlation was found between light threshold and electrical threshold (R2 < 0.52, P = 0.01). Multivariate modeling indicated that electrode-retina distance and light threshold are highly predictive of electrode threshold (R2 = 0.87; P < 0.0005).

Conclusions: Taken together, these results suggest that while light threshold should be used to inform patient selection, macular contact of the array is paramount.

Translational relevance: Reported Argus II clinical study results are in good agreement with prior in vitro and in vivo studies, and support the development of higher-density systems that employ smaller diameter electrodes. (clinicaltrials.gov identifier: NCT00407602).

Keywords: retinal degeneration; retinal prosthesis; retinitis pigmentosa.


Figures

Figure 1.
Figure 1.
The Argus II system. An illustration showing the surgically implanted stimulating microelectrode array, and inductive coil telemetry link of the Argus II system (left). The external portions of the system consist of a VPU (middle), and a miniature camera mounted on a pair of glasses (right). The glasses contain the half of the inductive link transmitting both power and data to the intraocular portion of the implant. (Reproduced from Ahuja AK, Dorn JD, Caspi A, et al. Blind subjects implanted with the Argus II retinal prosthesis are able to improve performance in a spatial-motor task. Br. J Ophthalmol. 2011;95:539-43, copyright 2011, with permission from BMJ Publishing Group Ltd.).
Figure 2.
Figure 2.
Spectral-domain optical coherence tomography (SD-OCT) with registered fundus images allow for electrode–retina distance to be measured. SD-OCT b-scans taken across portions of 12-001′s electrode array (top left) using a Cirrus SD-OCT and 52-001′s array (bottom left) using a Topcon SD-OCT. The metal electrodes block light from the scanning light source, casting shadows (white arrows) on the retinal image. Electrode shadows along with corresponding registered fundus images (top right) allow for the measurement of electrode–retina distance. (Bottom right) Fundus image of subject 61-003.
Figure 3.
Figure 3.
A fundus photograph illustrating the variables used to calculate electrode–fovea distance and orientation. ϕ is the angle of the array long axis relative to horizontal. θ is the angle between the fovea to array (vector R) and the horizontal.
Figure 4.
Figure 4.
The effect of electrode–retina distance (left), electrode–fovea distance (middle), and light sensitivity (right) on mean electrode threshold (top), the percentage of electrodes with thresholds below 0.35 mC/cm2 (middle), and the percentage below 1 mC/cm2 (bottom). Linear regression (dashed line) showed that electrode–retina distance and monocular light threshold (measured in decibels with 0 dB = 3 (cd)(s)/m2) correlate with mean threshold and percentage of electrodes with thresholds below 0.35 mC/cm2. Square of distance fitting on mean threshold versus electrode–retina distance (bold dashed line) did not fit the data better than linear fitting. Error bars indicate ± standard deviation. Each data point is scaled to represent the number of electrodes included in the analysis for each subject (i.e., the largest circle represents inclusion of all electrodes in the array).
Figure 5.
Figure 5.
The effect of local ganglion cell density on stimulus threshold. (top) Mean threshold current amplitude (black circles) and ganglion cell density (grey connected symbols represent each retinal quadrant from Curcio and Allen's whole-mount study, solid grey line is the mean of these four quadrants) plotted against foveal eccentricity. Only electrodes in contact with the retina are included (in contrast with data plotted in Fig. 4), and electrodes are pooled across all subjects. Each solid black circle is representative of a 0.5 mm foveocentric bin with increasing diameter representative of electrode count for that bin. Vertical bars represent standard error. Mean threshold (black circles of varying diameter) and anatomical data correlated well (P = 0.03). (bottom) Percentage of electrodes with thresholds below 0.35 (solid line) and 1 mC/cm2 (dashed line) plotted against foveal eccentricity (0.5-mm bins up to 4 mm from fovea centralis; 1-mm bins at eccentricities greater than 4 mm to ensure minimum sample size was 10 electrodes/bin). Bin count ranged from 11 to 63 electrodes.

References

    1. Marc RE, Jones BW, Watt CB, Strettoi E. Neural remodeling in retinal degeneration. Prog Retin Eye Res. 2003;22(5):607–655. - PubMed
    1. Santos A, Humayun MS, de Juan E, Jr, et al. Preservation of the inner retina in retinitis pigmentosa. A morphometric analysis. Arch Ophthalmol. 1997;22(4):511–515. - PubMed
    1. Stone JL, Barlow WE, Humayun MS, de Juan E, Jr, Milam AH. Morphometric analysis of macular photoreceptors and ganglion cells in retinas with retinitis pigmentosa. Arch Ophthalmol. 1992;110(11):1634–1639. - PubMed
    1. Rizzo JF, 3rd, Wyatt J, Loewenstein J, Kelly S, Shire D. Perceptual efficacy of electrical stimulation of human retina with a microelectrode array during short-term surgical trials. Invest Ophthalmol Vis Sci. 2003;44(12):5362–5369. - PubMed
    1. Zrenner E, Stett A, Weiss S, et al. Can subretinal microphotodiodes successfully replace degenerated photoreceptors? Vision Res. 1999;39(15):2555–2567. - PubMed

Associated data