. 2013 Apr 21;2(3):153-60.
doi: 10.1016/j.molmet.2013.04.002. eCollection 2013.

(11)C-meta-hydroxyephedrine PET/CT imaging allows in vivo study of adaptive thermogenesis and white-to-brown fat conversion

Affiliations

(11)C-meta-hydroxyephedrine PET/CT imaging allows in vivo study of adaptive thermogenesis and white-to-brown fat conversion

Carmelo Quarta et al. Mol Metab. .

Abstract

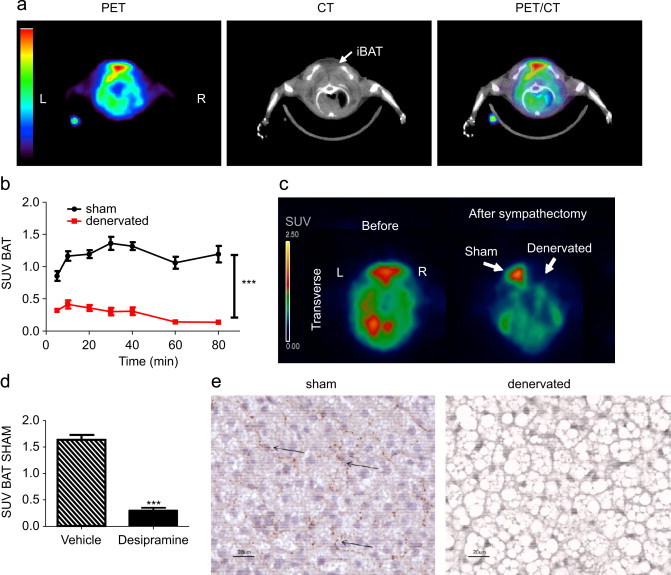
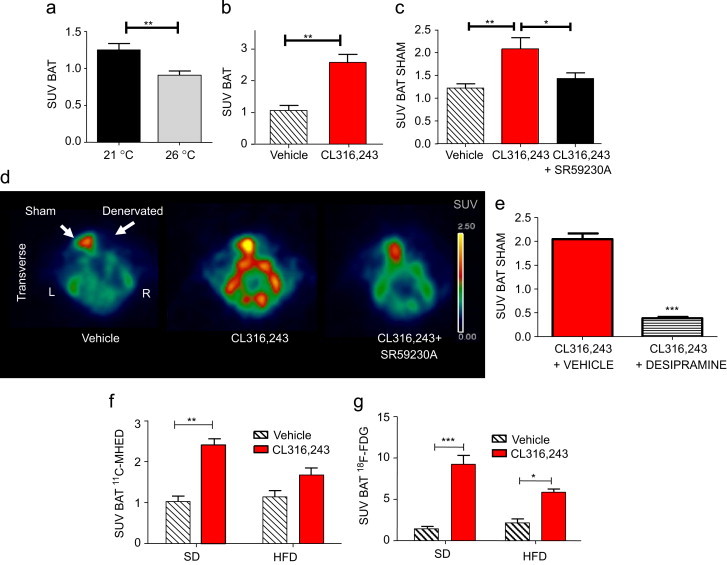
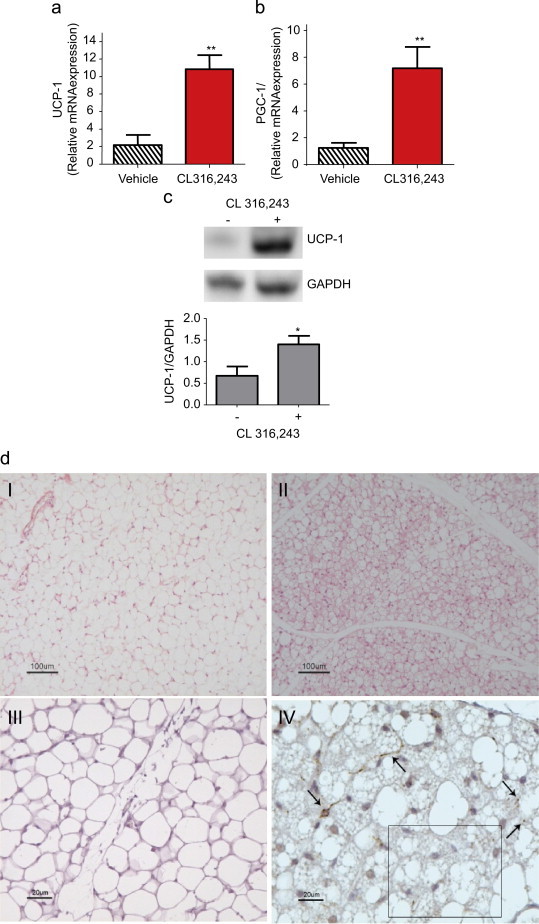
Several lines of evidence suggest that novel pharmacological approaches aimed at converting white adipose tissue (WAT) into brown adipose tissue (BAT) may represent an effective therapeutic strategy for obesity and related disorders. ((18))F-fluorodeoxyglucose ((18)F-FDG) is the only positron emission tomography (PET) tracer commonly used to study BAT function, and so far no functional tools have been described to investigate in vivo white-to-brown fat conversion. In this report, we show that the PET tracer (11)C-meta-hydroxyephedrine ((11)C-MHED, a norepinephrine analogue) is a useful tool to investigate the sympathetic nervous system (SNS) activity in BAT of lean and dietary obese mice. Moreover, we demonstrate that (11)C-MHED is a specific marker of the SNS-mediated thermogenesis in typical BAT depots, and that this tracer can detect in vivo WAT to BAT conversion.

Keywords: Brown adipose tissue; PET/CT imaging; Sympathetic activity.


Figures

Figure 1
Figure 1
Analysis of 11C-MHED bio-distribution in BAT. See also Figure S1. (a) Transverse views of PET (left), CT (middle), and PET/CT fused (right) images showing 11C-MHED uptake in the iBAT (arrow) of a representative mouse. L: left and R:right. (b) PET/CT analysis of the time-course of 11C-MHED distribution in SNS-denervated (n=6) or sham-operated (n=6) iBAT depots of C57BL/6 mice analyzed by several repeated PET/CT scans. **p<0.005, ***p<0.0005 vs. denervated. Data are expressed as standardized uptake value (SUV), representing radioactive counts per gram of tissue, divided by injected dose of radioactivity per gram of animal weight. (c) Transverse PET images showing 11C-MHED uptake in the iBAT before and after monolateral resection of the SNS fibers innervating BAT. (d) PET/CT analysis of 11C-MHED uptake in sham-operated iBAT lobe of mice pre-treated with vehicle (n=4) or desipramine (n=7) (10 mg/kg i.p.), 30 min before tracer injection. ***p<0.0005 vs. vehicle. (e) Representative photomicrographs showing TH immunoreactivity (arrows) in a sham-operated and in an SNS-denervated iBAT lobe. Magnification, ×40.
Figure 2
Figure 2
Analysis of 11C-MHED uptake in BAT following experimental activation of SNS. See also Figure S1. (a) Analysis of 11C-MHED uptake in iBAT of mice acclimated either at 21 °C (n=8) or 26 °C for 3 months (n=9). **p<0.005 vs. vehicle. (b) Analysis of 11C-MHED uptake in iBAT of animals chronically treated either with vehicle (n=5) or CL316,243 (n=6, 1 mg/kg per day, i.p.) for 4 weeks. **p<0.005 vs. vehicle. (c) Analysis of 11C-MHED uptake in sham-operated iBAT lobe of mice (n=5) by three repeated PET/CT scans (1 week of recovery between the scans) perfomed after vehicle, CL316,243, or CL316,243+SR59230A acute administration. **p<0.005 vs. vehicle *p<0.05 vs. CL316,243. CL316,243 (1 mg/kg i.p.) was injected 1 h before tracer administration. SR59230A (5 mg/kg per os) pre-treatment was performed 1 h before CL316,243 injection. (d) Representative PET image showing 11C-MHED accumulation in sham-operated and SNS-denervated iBAT lobe (arrows) of a representative mouse treated as in Figure 2c. (e) PET/CT analysis of 11C-MHED uptake in sham-operated iBAT lobe of mice treated with CL316,243 (1 mg/kg i.p.) and subsequent (30 min later) injection of vehicle (n=5) or desipramine (n=5) (10 mg/kg i.p.). Tracer was injected 1 h after CL316,243 administration.***p<0.0005 vs. vehicle. (f) Analysis of 11C-MHED uptake in iBAT of SD (n=5) and HFD (n=5) mice by two repeated PET/CT scans, performed following acute (1 h) treatment either with vehicle or CL316,243 (1 mg/kg i.p.). ***p<0.0005 vs. SD vehicle by Bonferroni post test. 2-way ANOVA shows significant interaction between diet type and treatment (p<0.05) and accounts for approximately 11,74% of the total variance with F=7.958. Diet accounts for approximately 6.20% of the total variance with F=4203. Treatment accounts for approximately 58.46% of the total variance with F=39.63. (g) Analysis of 18F-FDG uptake (SUV) in iBAT of lean SD and HFD mice as in Figure 2 f. ***p<0.0005 vs. SD vehicle, *p<0.05 vs. HFD vehicle by Bonferroni post test. 2-way ANOVA shows significant interaction between diet type and treatment (p<0.01) and accounts for approximately 6.71% of the total variance with F=7.78. Diet accounts for approximately 61.09% of the total variance with F=70.86. Treatment accounts for approximately 6.51% of the total variance with F=7.55.
Figure 3
Figure 3
PET/CT imaging of WAT following treatment with a β3-AR agonist. See also Figure S2. (a) Coronal (top) and transverse (bottom) views of PET/CT fused (left) and CT (right) images showing 11C-MHED and 18F-FDG accumulation in the i.s. WAT (arrows) of a representative mouse chronically treated with CL316,243 for 4 weeks. Radioactive counts are expressed as SUV. Red lines indicate the image sections reported in the transverse views. (b) Analysis of 11C-MHED uptake in the i.s. WAT of mice chronically treated with vehicle (n=5) or with CL316,243 (n=6), and analyzed by PET/CT imaging after 3 weeks or 4 weeks of CL316,243 administration. ****p<0.0005 vs. vehicle; *p<0.05 vs. vehicle or CL316,243 (3 weeks). SUV values for mice treated for 3 and 4 weeks with vehicle were cumulated since they were not statistically different. (c) Analysis of 18F-FDG uptake in WAT of the animals in which we obtained the results shown in Figure 3b, after 3 weeks or 4 weeks of CL316,243 administration. ***p<0.0005 vs. vehicle; *p<0.05 vs. vehicle or CL316,243 (3 weeks). SUV values for mice treated for 3 and 4 weeks with vehicle were cumulated since they were not statistically different. (For interpretation of the references to color in this figure legend, the reader is referred to the web version of this article.)
Figure 4
Figure 4
Ex-vivo analysis of WAT-to-BAT conversion. (a) UCP-1 mRNA expression analyzed by qPCR in the i.s. WAT, after 4 weeks of vehicle or CL316,243 administration, in the same animals shown in Figure 3b and c. **p<0.005 vs. vehicle. (b) PGC-1α mRNA expression analyzed by qPCR in the i.s. WAT, as in a. **p<0.005 vs. vehicle. (c) Western blot analysis of UCP-1 levels in the i.s. WAT as in a. Relative UCP-1 values for densitometric analysis were determined by normalization for the house-keeping protein GAPDH. (d) H&E staining (top, magnification ×10) and immunohistochemistry for TH (bottom: magnification ×40), in sections of i.s. WAT of mice chronically treated with vehicle (left: I and III) or CL316,243 (right: II and IV) for 4 weeks. Arrows indicate TH-positive parenchymal fibers.

References

    1. Rothwell N.J., Stock M.J. A role for brown adipose tissue in diet-induced thermogenesis. Nature. 1979;281:31–35. - PubMed
    1. Cannon B., Nedergaard J. Brown adipose tissue: function and physiological significance. Physiological Reviews. 2004;84:277–359. - PubMed
    1. Feldmann H.M., Golozoubova V., Cannon B., Nedergaard J. UCP1 ablation induces obesity and abolishes diet-induced thermogenesis in mice exempt from thermal stress by living at thermoneutrality. Cell Metabolism. 2009;9:203–209. - PubMed
    1. Cederberg A., Grønning L.M., Ahrén B., Taskén K., Carlsson P., Enerbäck S. FOXC2 is a winged helix gene that counteracts obesity, hypertriglyceridemia, and diet-induced insulin resistance. Cell. 2001;106:563–573. - PubMed
    1. Bartelt A., Bruns O.T., Reimer R., Hohenberg H., Ittrich H., Peldschus K. Brown adipose tissue activity controls triglyceride clearance. Nature Medicine. 2011;17:200–205. - PubMed

LinkOut - more resources