Review
. 2013 Nov;46(4):283-322.
doi: 10.1017/S0033583513000061. Epub 2013 Sep 20.

Nicotinic acetylcholine receptor and the structural basis of neuromuscular transmission: insights from Torpedo postsynaptic membranes

Affiliations
Free PMC article
Review

Nicotinic acetylcholine receptor and the structural basis of neuromuscular transmission: insights from Torpedo postsynaptic membranes

Nigel Unwin. Q Rev Biophys. 2013 Nov.
Free PMC article

Abstract

The nicotinic acetylcholine (ACh) receptor, at the neuromuscular junction, is a neurotransmitter-gated ion channel that has been fine-tuned through evolution to transduce a chemical signal into an electrical signal with maximum efficiency and speed. It is composed from three similar and two identical polypeptide chains, arranged in a ring around a narrow membrane pore. Central to the design of this assembly is a hydrophobic gate in the pore, more than 50 Å away from sites in the extracellular domain where ACh binds. Although the molecular properties of the receptor have been explored intensively over the last few decades, only recently have structures emerged revealing its complex architecture and illuminating how ACh entering the binding sites opens the distant gate. Postsynaptic membranes isolated from the (muscle-derived) electric organ of the Torpedo ray have underpinned most of the structural studies: the membranes form tubular vesicles having receptors arranged on a regular surface lattice, which can be imaged directly in frozen physiological solutions. Advances in electron crystallographic techniques have also been important, enabling analysis of the closed- and open-channel forms of the receptor in unreacted tubes or tubes reacted briefly with ACh. The structural differences between these two forms show that all five subunits participate in a concerted conformational change communicating the effect of ACh binding to the gate, but that three of them (αγ, β and δ) play a dominant role. Flexing of oppositely facing pore-lining α-helices is the principal motion determining the closed/open state of the gate. These results together with the findings of biochemical, biophysical and other structural studies allow an integrated description of the receptor and of its mode of action at the synapse.


Figures

Fig. 1.
Fig. 1.
Rows of paired receptors (dimer ribbons) and their relationship to tubes. (a) Freeze-fracture, deep-etched image of the extracellular surface of a postsynaptic membrane fragment obtained from gently sheared Torpedo tissue, showing dimer ribbons partially packed side-by-side. (b)–(e) Negative stain images of ACh receptor-rich vesicles after stronger mechanical treatment, followed by incubation in a low salt solution. (b), (c) The mechanical treatment destroys the original regular packing of receptors, but with time the dimer ribbons and the side-by-side arrangements reappear. Tube formation ((d), bottom and (e)) appears to be driven by tight side-by-side packing of the dimer ribbons. Arrows in (c) and (d) identify loosely packed ribbons, which in (d) are continuous with those forming the tube. ((a) is from Heuser & Salpeter, ; (b)–(d) are from Brisson & Unwin, 1984). Scale bars: 500 Å.
Fig. 2.
Fig. 2.
Analysis of flattened tubes. (a) Fourier transform (upper) and surface lattice (lower), viewed from the outside of a tube. Transforms from typical tubes contain only a small number of independent h,k peaks, the amplitudes of which are proportional to the shown diameters. The weak peaks, for which k is odd (‘superlattice’ peaks) are associated with a doubling of the b dimension of the surface lattice (indicated by alternate rows of closed and open circles along the (0,1) lines). Typical values for the cell dimensions are: a=90 Å, b=162 Å, γ=118°. (b) Three-dimensional map at 25 Å resolution of receptor molecules in the surface lattice as they would appear viewed from the synaptic cleft. The dimer ribbon lies in a horizontal direction, and the centre-to-centre separation of receptors along the ribbon is 90 Å. The δ subunits of neighbouring receptors are labelled to indicate the location of the δ–δ disulphide bridge. Successive sheets are of sections parallel to the membrane plane separated by spaces corresponding to 5 Å; data from ice-embedded flattened tubes. (Fig. 10 gives more details of the packing and the subunit arrangement around the pentamer. (a) is from Brisson & Unwin, ; (b) is adapted from Brisson & Unwin, 1985).
Fig. 3.
Fig. 3.
Electron images of ACh-receptor tubes in amorphous ice, spanning holes in the carbon support film. The three tubes shown belong to different helical families and have different diameters, characteristic of the particular family. In each example, the two indices in the upper right-hand corners denote the start numbers of the two principal helices, deduced from Fourier transforms of the images (see Fig. 4), (from Toyoshima & Unwin, 1990). Scale bar: 1000 Å.
Fig. 4.
Fig. 4.
The helical p2 surface lattice and 3D image reconstruction. (a) The surface lattice consists of a regular array of receptor dimers (linked circles) arranged on a cylindrical surface. The diagram is made by opening the cylinder and viewing it from the outside. The vertical axis is parallel to the tube axis and the horizontal axis shows the azimuthal angle around this axis; a line on the surface lattice corresponds to a helix. The lattice can be characterized by the numbers (start numbers) of the two principal lines (helices) required to fill 360° of azimuth. In this example, a 16-start left-handed helix and a 6-start right-handed helix, denoted by (1, 0) and (0, 1), respectively, are the principal helices; the lattice is therefore of the (−16, 6) family. Unit cell vectors, a and b, are indicated. (b) The ribbons of receptor dimers, lying along the a-direction in (a), form helices having slightly different pitches depending on the helical family and the exact dimensions of the unit cell. (c) Surface representation reconstructed from images of (−16, 6) tubes embedded in ice. The darker shading highlights the basic helix formed by a dimer ribbon of receptors.
Fig. 5.
Fig. 5.
Structures obtained by averaging data from images of ice-embedded tubes spanning holes in the carbon support film. (a) Cross-section normal to the tube axis showing the extracellular (outside) and intracellular (inside) portions of the receptors projecting from the phospholipid headgroup regions of the membrane (pair of concentric rings of density, 30 Å apart). A single receptor, cut centrally, is identified by the vertical arrow. (b) A single receptor in profile with positions of transmembrane rods and estimated limits of the lipid bilayer (dotted lines, 30 Å apart) superimposed. (c) α-helical net plot giving a tentative alignment of the amino acid sequence along the M2 pore-lining helix (Torpedo α subunit) with the densities in the map. The alignment suggests that a highly conserved leucine residue (L251; asterisk) lies near the middle of the membrane at the narrowest part of the pore. ((b) and (c) from Unwin, 1993).
Fig. 6.
Fig. 6.
Measurement and correction of distortions. (a) Electron micrograph of an ice-embedded tube ((−15, 7) helical family), recorded at liquid helium temperatures using a 300 kV field emission microscope (defocus: 17 400 Å). The contrast is low due to the high accelerating voltage, but the low imaging temperature and the high stability of the microscope ensures that the finest details are present. The boxed region shows a typical-sized segment which is scanned along the length of the tube to measure the distortions present. (b) Plots showing the variation of several parameters (tube axis position; bend angle; tilt angle; apparent repeat length) along the length of the tube, determined from the segments (Beroukhim & Unwin, 1997). A complete 3D alignment (defined by eight parameters) is obtained from each segment and the aligned segments are added to reconstruct a whole helical repeat. Subsequently, whole repeats along the length of the tube are averaged together. The same procedure, using overlapping segments, leads to a significant improvement in signal-to-noise ratio at higher resolution (Fisher et al. ; Unwin & Fujiyoshi, 2012). As is typical, the tube shown bends only slightly in-plane (bend angle), but bends more substantially out-of-plane (tilt angle) and varies in apparent helical repeat (with corresponding variations in unit cell dimensions of the surface lattice).
Fig. 7.
Fig. 7.
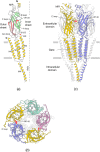
Architecture and fold of the ACh receptor (closed-channel form (2BG9)), illustrated with ribbon diagrams. (a) The αγ subunit viewed from the side, with the central axis of the receptor on the right; the outer and inner sheets composing the β-sandwich core are in pink and green, respectively. The loops A, B and C harbour ACh-binding residues (see Fig. 8). (b) Whole assembly, as viewed from the synaptic cleft, with individual subunits identified; the C loop of αδ (broken trace) is not resolved in the density map, whereas the C loop of αγ is clearly seen, presumably because its flexibility is restricted by interactions with the equivalent loop on a neighbouring receptor. (c) Whole assembly viewed from the side with the αγ and γ subunits in foreground. Also shown in the figures in red are the side-chains of the ACh-binding residue αW149 on the B loop and αV46 on the β1/β2 loop. The position of the membrane is indicated by the horizontal bars.
Fig. 8.
Fig. 8.
ACh-binding site of AChBP in the presence of the ACh analogue, carbamylcholine (1UV6; Celie et al. 2004). The view of the whole pentamer (left) is equivalent to that of the receptor in Fig. 7b, with a binding site region identified by a square. The enlargement of the square (right) shows the principal ‘α subunit’ component of the binding site, including the arrangement of conserved aromatic side-chains and a conserved cysteine residue, which co-oordinate with the bound ligand. The tryptophan on the B loop, the tyrosines on the A and C loops, and the cysteine on the C loop are equivalent, respectively to αW149, αY93, αY190 and αC192 of the receptor. (ACh differs from carbamylcholine only by the replacement of the NH2 group with a methyl group).
Fig. 9.
Fig. 9.
Membrane-spanning structure of closed channel (2BG9). (a) View down the axis of the receptor (extracellular side uppermost) showing the symmetrical pentagonal arrangement made by the ∼40 Å long transmembrane α-helices. Each subunit contributes four helices, M1-M4, which are splayed apart at their extracellular ends, but come closer together towards the intracellular membrane surface, creating a tapered central pore. The bent pore-lining M2 helices are somewhat separated from the ring of M1/M3 helices, most especially in the extracellular portion of the bilayer. The M2 helices only make significant contacts with each other at the middle of the membrane and in the intracellular leaflet of the bilayer. At least two rings of hydrophobic side-chains (indicated by the yellow sticks, at positions 9′ and 13′) project into the pore from the encircling helices, to create a barrier for ion permeation near the middle of the membrane. The arrows indicate the directions in which αγM2 and δM2 flex to straighten when the channel opens. (b) Side view with the front two subunits removed, showing the tapered pore profile made by the bent M2 helices of the αγ and δ subunits. The pore narrows from the extracellular side (uppermost) to become most constricting near the middle of the bilayer (asterisk), where the large hydrophobic residues are located. The density contours superimposed on the atomic model are from the 6-Å closed-class structure (see Section 5), i.e. using data from different helical families than were used to derive the model. The indicated curvature and positions of the helices are the same in either case. The locations of specific pore-facing amino acid residues on αγM2 (at positions: −1′ (E), 2′ (T), 9′ (L), 13′ (V) and 20′ (E)) are shown. The pink contours indicate the locations of the rings of density associated with the phospholipid headgroup regions of the lipid bilayer (see Fig. 5a).
Fig. 10.
Fig. 10.
Packing of receptors and subunit arrangement on the surface of a tube, viewed parallel with (upper) and normal to (lower) the plane of the membrane. Individual molecules come closest to each other at the two unique radial twofold axes (asterisks). A disulphide bridge between cysteine residues of neighbouring δ subunits lies at one such axis (blue asterisk); the C loops of neighbouring α subunits (αγ) lie at the other (red asterisk). The angles to the tube axis made by the dimer ribbons (identified by the pair of obliquely sloping broken lines in lower panel) range from 64 to 72°, depending on the helical family ((−16, 6) family in this example). The pair of arrows in the bottom panel indicates the plane including both twofold axes, and hence the orientation of the slab through the structure shown in the top panel.
Fig. 11.
Fig. 11.
Ribbon diagrams of the ACh receptor and related proteins. (a) Superposition of the mouse α1 subunit (2QC1) with the αγ subunit of the ACh receptor (2BG9). (b) AChBP (1I9B). (c) GluCl (3RIA). (d) Superposition of GluCl (open channel, stabilized by ivermectin (3RIA)) with the ACh receptor (closed channel (2BG9)) at the level of the gate. Related proteins are in gold; the ACh receptor is in grey.
Fig. 12.
Fig. 12.
Spray-freeze trapping. (a) The grid-supported solution containing tubes is allowed to drop by free-fall into liquid-nitrogen-cooled liquid ethane and is sprayed with an ACh solution containing ferritin marker particles just before it hits the ethane surface. The atomiser spray produces a pulse of concentrated ∼1 μm diameter droplets, and the reaction time is made brief by having the level of the nozzle only a short distance above the ethane surface. The distances d1 and d2 are typically 4 and 0.8 cm, respectively. (b) Tubes that have interacted with ACh can be identified from the images by the presence of nearby ferritin particles (arrow). (c) Mixing of a 1 μm diameter spray droplet, containing ACh and ferritin, with the grid-supported aqueous film 10 ms after impact: ACh (reddish colour) spreads beyond the ferritin (dots) within the zone of coalescence (inner dashed circle), reaching some tubes by diffusion. ACh receptors in tubes located in this outer ‘diffusion zone’ may have received saturating amounts of ACh for up to ∼2 ms and so would also have a high probability of being open. These tubes can be identified a posteriori by correlation against closed-channel and open-channel reference structures. ((a) is from Berriman & Unwin (1994); (c) is from Unwin & Fujiyoshi (2012)).
Fig. 13.
Fig. 13.
Closure of C loop and widening of pore on activation by ACh. (a) and (b) show the C-loop conformations of αγ in the closed- and open-channel forms, respectively, in equivalent slabs through the two 6 Å density maps. The view is similar to that of Fig. 7b, from the synaptic cleft, and is adjacent to a radial twofold axis (cross) in the tubular surface lattice. Also shown are the superimposed Cα backbones from the atomic model of the closed channel (black (2BG9)) and, in (b), loop C from the aligned AChBP complexed with carbamylcholine (green (1UV6); Celie et al. 2004). (c) and (d) show the pore profiles made by the helices, αγM2 and δM2 in the closed- and open-channel forms, respectively, in equivalent near-axial slabs through the two 6 Å density maps. The fitted Cα backbones (black, closed; red, open) are superimposed. These helices widen the pore by straightening (arrows) in response to ACh binding, as indicated for αγM2 by comparison with the overlaid broken line. The straightening of δM2 is not fully evident in this figure because it occurs predominantly in a direction tangential to the axis of the pore (see Figs. 9a, 15). The vertical yellow bar in (c) identifies the location of the gate, near the middle of the membrane (grey bars). Extracellular side is uppermost. The net spacing corresponds to 1 Å. Contours are at 1σ. (From Unwin & Fujiyoshi, 2012).
Fig. 14.
Fig. 14.
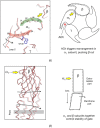
Conformational change driving channel opening. (a) Slab showing fitted Cα backbones (black, closed; red, open) through the closed- and open-class density maps at the level of the ACh-binding site in αγ. Closure of the C loop around the bound ACh is accompanied by rotation (curved arrow) of the outer sheet (pink shading). The displacement of the outer sheet is accommodated by a readjustment of the inner sheet (green shading), resulting in outward displacement of the extracellular part of β (yellow arrow). Individual β-strands, and W149, are also identified in the figure. These changes are indicated in the sketch of the whole cross-section on the right. (b) The outward displacement of the extracellular part of β (upper black arrow), driven by αγ (yellow arrow), is coupled to tilting of the membrane part (lower black arrow), affecting the stability of the hydrophobic gate. The sketch on the right indicates that both components move from their closed-channel positions (broken lines) as rigid bodies. (Adapted from Unwin & Fujiyoshi, 2012).
Fig. 15.
Fig. 15.
Pore opening is mediated principally by the αγ, δ and β subunits. Different movements are involved, depending on the subunit in question, as shown by superpositions of the Cα backbones fitted to the closed-class (grey) and open-class (red) density maps. In (a) αγM2 converts from a bent conformation to a straight conformation by flexing by up to 1.5 Å towards αγM3 (arrow); this is in a radial direction with respect to the axis of the pore. The remaining helices (M1, M3 and M4) retain approximately fixed positions. In (b) δM2 converts from a bent conformation to a straight conformation by flexing to a similar degree as αγM2, but towards the space between βM1 and δM3. This flexure therefore has a tangential component with respect to the pore axis, exposing a crevice (arrow, blue wedge) between δM2 and αδM2. The view shown is from inside the pore. In (c) all four helices of β tilt equally by ∼2°, as indicated by the pairs of overlaid lines. (d) Shows the directions of movement of the pore-lining M2 helices in each example, relative to the axis of the pore (see also Fig. 9a). ((a)–(c) from Unwin & Fujiyoshi, 2012).
Fig. 16.
Fig. 16.
Mechanism of switching between closed and open states. (a) ACh on entering the two binding sites induces a concerted conformational change, in which the αγ, β and δ subunits, shown here, play the principal roles. The αγ subunit undergoes a small β-sheet rearrangement, driving the conformational change; the β subunit communicates the rearrangement in αγ to the gate; and the pore-lining helix of δ (along with that of αγ) straightens, altering the size, shape and polarity of the pore. Arrows denote the movements linking the binding site in αγ to the gate; red arrow: inward displacement of C loop; green arrow: displacement of inner β-sheet of αγ towards β subunit; yellow arrow: outward displacement and tilting of β subunit; black arrows: straightening of the pore-lining helices of αγ and δ in radial and near-tangential directions, affecting the gate. Outer and inner β-sheets of αγ are in pink and green, respectively; pore-lining M2 helices of αγ and δ are in blue; gate, yellow bar. (b) Shows the alternative pore configurations before (closed) and after (open) the transition. Although the lumen of the closed pore is wider than the diameter of a Na+ ion (cyan sphere) at the gate (yellow bar), the pore-lining hydrophobic side-chains (yellow spheres) present an energy barrier to ion flow through the pore. The open pore is wider and more polar at the gate, due mainly to the straightening of αγM2 and δM2, allowing ions to pass through.

References

    1. Adrian A. M., Dubochet J., Lepault J. & Mcdowall A. W. (1984). Cryo-electron microscopy of viruses. Nature 308, 32–36 - PubMed
    1. Andreeva I. E., Nirthanan S., Cohen J. B. & Pedersen S. E. (2006). Site specificity of agonist-induced opening and desensitisation of the Torpedo californica nicotinic acetylcholine receptor. Biochemistry 45, 195–204 - PubMed
    1. Auerbach A. (2010). The gating isomerization of acetylcholine receptors. Journal of Physiology 588, 573–586 - PMC - PubMed
    1. Auerbach A. (2012). Thinking in cycles: MWC is a good model for acetylcholine receptor-channels. Journal of Physiology 590, 93–98 - PMC - PubMed
    1. Baker T. S., Caspar D. L. D. & Murakami W. T. (1983). Polyoma virus ‘hexamer’ tubes consist of paired pentamers. Nature 303, 446–448 - PMC - PubMed

Publication types

LinkOut - more resources