
Intraspecific variation of recombination rate in maize

Eva Bauer et al. Genome Biol. 2013.

Abstract

Background: In sexually reproducing organisms, meiotic crossovers ensure the proper segregation of chromosomes and contribute to genetic diversity by shuffling allelic combinations. Such genetic reassortment is exploited in breeding to combine favorable alleles, and in genetic research to identify genetic factors underlying traits of interest via linkage or association-based approaches. Crossover numbers and distributions along chromosomes vary between species, but little is known about their intraspecies variation.

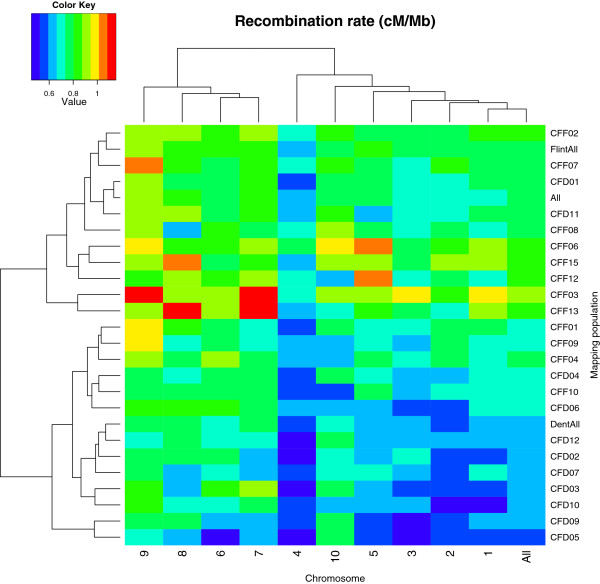
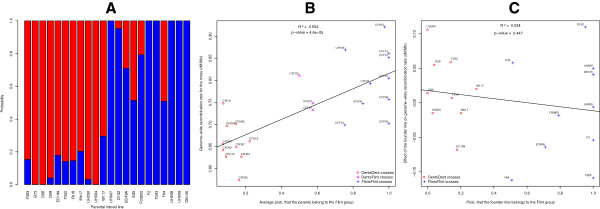
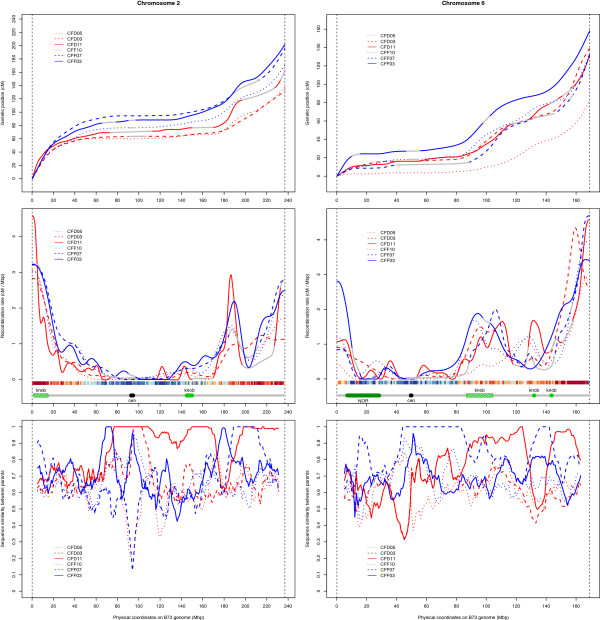
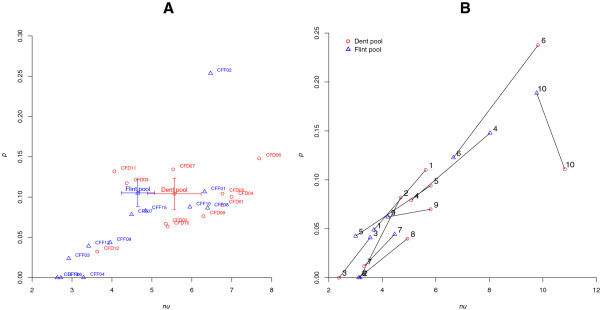
Results: Here, we report on the variation of recombination rates between 22 European maize inbred lines that belong to the Dent and Flint gene pools. We genotype 23 doubled-haploid populations derived from crosses between these lines with a 50 k-SNP array and construct high-density genetic maps, showing good correspondence with the maize B73 genome sequence assembly. By aligning each genetic map to the B73 sequence, we obtain the recombination rates along chromosomes specific to each population. We identify significant differences in recombination rates at the genome-wide, chromosome, and intrachromosomal levels between populations, as well as significant variation for genome-wide recombination rates among maize lines. Crossover interference analysis using a two-pathway modeling framework reveals a negative association between re combination rate and interference strength.

Conclusions: To our knowledge, the present work provides the most comprehensive study on intraspecific variation of recombination rates and crossover interference strength in eukaryotes. Differences found in recombination rates will allow for selection of high or low recombining lines in crossing programs. Our methodology should pave the way for precise identification of genes controlling recombination rates in maize and other organisms.


Figures

Figure 1
Figure 1
Diversity of recombination rates. Heat map of the chromosome-wide recombination rates measured for each chromosome in the 23 genetic maps. On the x-axis, 'All' corresponds to a pooled analysis of all chromosomes. On the y-axis, 'DentAll', 'FlintAll', and 'All' correspond to pooled analyses with all Dent × Dent populations, all Flint × Flint populations, and all 23 populations together, respectively. Warmer colors indicate higher recombination rates. Dendrograms indicate hierarchical clustering of -log10(P value) based on Euclidian distances, and were used to order the populations and chromosomes.
Figure 2
Figure 2
Structure analysis of parental lines and correlation of structure with genome-wide recombination rate. (A) Probability of each parental inbred line to belong to the Dent (red) and the Flint (blue) groups. (B) For each of the 23 populations, correlation between the average probability of the two parents of the population to belong to the Flint group, and genome-wide recombination rate (GWRR) in the population. (C) For each of the 19 founder lines excluding B73, correlation between the probability to belong to the Flint group, and the contribution to GWRR for that parental line, using an additive model whereby the GWRR for a cross is the average GWRR of the two parents of the cross. The effect of the central line was corrected for based on the two populations CFD02 and CFF02, which involve B73 crossed to the two central lines F353 and UH007.
Figure 3
Figure 3
Recombination rates along chromosomes. The x-axis indicates the physical position (Mbp) along chromosomes 2 (left panels) and 6 (right panels). The y-axis indicates the genetic position (cM; top panels), recombination rate (cM/Mbp; middle panels), and pairwise parental similarity (frequency of identical SNP alleles in 10 Mbp sliding windows with a step size of 2 Mbp; bottom panels) for six of the 23 populations, after smoothing and imputation. Blue lines: Flint × Flint crosses. Red lines: Dent × Dent crosses. In both groups, the solid, dashed and dotted lines correspond to the population with the highest, median and lowest genome-wide recombination rate within its group, respectively. Gray parts of the lines correspond to regions where the information was missing or not reliable (IBD segments, non-colinearity with B73), and was thus imputed from the other maps. Heat maps below the curves of recombination rates indicate gene density (low for cold colors and high for hot colors). Gray horizontal line below the heat-map: sketch of the chromosome organization showing centromeres (cen), knobs, and nucleolar organizer region (NOR). Centromere, knob and NOR positions are from [30]. Color filling of chromosome features is solid when the estimated boundaries of the region are known, and hatched when the box indicates only the extremities of the bin containing the region.
Figure 4
Figure 4
Diversity of interference characteristics. Parameter nu of the Gamma model measuring interference intensity in pathway P1 (x-axis), versus fraction p of crossovers formed via the non-interfering pathway P2 (y-axis). (A) Parameters estimated for each population and the 10 chromosomes pooled together. Red circles: Dent × Dent populations. Blue triangles: Flint × Flint populations. Corresponding population names are indicated beside each point. Pooled data for the two pools Dent and Flint are indicated with their 95% confidence intervals (error bars). (B) Parameters for the pooled data of all Dent × Dent populations (red circles) and all Flint × Flint populations (blue triangles) estimated for each individual chromosome. Corresponding chromosome numbers are indicated beside each point.

References

    1. Keeney S, Giroux CN, Kleckner N. Meiosis-specific DNA double-strand breaks are catalyzed by Spo11, a member of a widely conserved protein family. Cell. 1997;14:375–384. doi: 10.1016/S0092-8674(00)81876-0. - DOI - PubMed
    1. Hunter N, Kleckner N. The single-end invasion: an asymmetric intermediate at the double-strand break to double-holliday junction transition of meiotic recombination. Cell. 2001;14:59–70. doi: 10.1016/S0092-8674(01)00430-5. - DOI - PubMed
    1. Anderson LK, Doyle GG, Brigham B, Carter J, Hooker KD, Lai A, Rice M, Stack SM. High-resolution crossover maps for each bivalent of Zea mays using recombination nodules. Genetics. 2003;14:849–865. - PMC - PubMed
    1. Moens PB, Kolas NK, Tarsounas M, Marcon E, Cohen PE, Spyropoulos B. The time course and chromosomal localization of recombination-related proteins at meiosis in the mouse are compatible with models that can resolve the early DNA-DNA interactions without reciprocal recombination. J Cell Sci. 2002;14:1611–1622. - PubMed
    1. Baudat F, Massy B. Regulating double-stranded DNA break repair towards crossover or non-crossover during mammalian meiosis. Chromosome Res. 2007;14:565–577. doi: 10.1007/s10577-007-1140-3. - DOI - PubMed

Publication types