. 2014 Feb:62:73-85.
doi: 10.1016/j.nbd.2013.09.003. Epub 2013 Sep 16.

The effect of STAT3 inhibition on status epilepticus and subsequent spontaneous seizures in the pilocarpine model of acquired epilepsy

Affiliations

The effect of STAT3 inhibition on status epilepticus and subsequent spontaneous seizures in the pilocarpine model of acquired epilepsy

H L Grabenstatter et al. Neurobiol Dis. 2014 Feb.

Abstract

Pilocarpine-induced status epilepticus (SE), which results in temporal lobe epilepsy (TLE) in rodents, activates the JAK/STAT pathway. In the current study, we evaluate whether brief exposure to a selective inhibitor of the JAK/STAT pathway (WP1066) early after the onset of SE affects the severity of SE or reduces later spontaneous seizure frequency via inhibition of STAT3-regulated gene transcription. Rats that received systemic WP1066 or vehicle at the onset of SE were continuously video-EEG monitored during SE and for one month to assess seizure frequency over time. Protein and/or mRNA levels for pSTAT3, and STAT3-regulated genes including: ICER, Gabra1, c-myc, mcl-1, cyclin D1, and bcl-xl were evaluated in WP1066 and vehicle-treated rats during stages of epileptogenesis to determine the acute effects of WP1066 administration on SE and chronic epilepsy. WP1066 (two 50mg/kg doses) administered within the first hour after onset of SE results in transient inhibition of pSTAT3 and long-term reduction in spontaneous seizure frequency. WP1066 alters the severity of chronic epilepsy without affecting SE or cell death. Early WP1066 administration reduces known downstream targets of STAT3 transcription 24h after SE including cyclin D1 and mcl-1 levels, known for their roles in cell-cycle progression and cell survival, respectively. These findings uncover a potential effect of the JAK/STAT pathway after brain injury that is physiologically important and may provide a new therapeutic target that can be harnessed for the prevention of epilepsy development and/or progression.

Keywords: B-cell lymphoma 2; B-cell lymphoma-extra large; Cyclin D1; G1/S-specific cyclin-D1 (encoded by CCND1); ICER; JAK; Janus kinase; STAT; Signal Transducer and Activator of Transcription; VEGF; bcl-2; bcl-xl; c-myc; cellular regulatory gene that codes for a transcription factor; induced myeloid leukemia cell differentiation protein; inducible cAMP Early Repressor protein; mcl-1; vascular endothelial growth factor.


Figures

Fig. 1
Fig. 1. WP1066 exhibited fast kinetics in vivo and in vitro
(A) WP1066 (100 mg/kg) has an apparent in vitro rat (Sprague-Dawley) plasma half-life (37 °C) of ~1.0 hr (n=1 per time point). (B) In vitro incubation of WP1066 (100 mg/kg) with rat liver microsomes (0.2 mg/mL) and NADPH (2.0 mM) illustrates that WP1066 has moderate stability (n= 3). (C) WP1066 (100 mg/kg) administered i.p. to a normal rat is present in the brain at low concentrations 5 minutes post-dose in vivo and clearance is very fast. (D) Cortex and plasma harvested from animals receiving 50 mg/kg WP1066 at onset of SE, a second 50 mg/kg WP1066 dose 45 minutes later, and sacrificed 1 h after SE onset (15 minutes after second WP1066 dose, n=8) demonstrate some blood-brain permeability but relatively low brain and plasma concentrations. Error bars, mean±SD.
Fig. 2
Fig. 2. WP1066 transiently inhibits SE-induced increases in STAT3 phosphorylation
Western blot of protein homogenates from DG of rats (A) 1 h and (B) 6 h after onset of SE probed with anti-pSTAT3 and STAT3 antibodies. 50 mg/kg of WP1066 (SE+WP1066) or vehicle (SE+DMSO) was injected i.p. at the onset of SE and again 45 minutes later. Control animals (CTL) received a sub-convulsive pilocarpine dose and did not experience SE. The ratio of pSTAT3/STAT3 was expressed as % change relative to mean values of the SE+DMSO group at each time point. WP1066 reduced SE-induced phosphorylation of STAT3 by ~58% 1 h after onset of SE (SE+DMSO, n=4; SE+WP1066, n=4), but no difference was demonstrated in the DG of WP1066-treated rats relative to DMSO-treated rats 6 h after the onset of SE (SE+DMSO, n=3; SE+WP1066, n=5).
Fig. 3
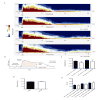
Fig. 3. WP1066 does not alter electrographic status epilepticus
Rats were continuously video-EEG monitored during and after pilocarpine-induced SE to conduct quantitative analyses of electrographic SE. 50 mg/kg of WP1066 (JAK/STAT Inhibitor) or vehicle (DMSO) was injected i.p. at the onset of SE and 50 mg/kg of the same treatment was administered again 45 minutes later. (A) Representative compressed spectral analyses (CSAs) are shown for the first ~19 hs following start of recording (including the time of pilocarpine administration. CSAs demonstrate magnitude power in low frequencies (0–50 Hz) over time following the onset of SE in animals implanted with 2 cortical EEG-recording electrodes treated with either vehicle (top 2 spectrographs) or WP1066 (bottom 2 spectrographs). Color map represents intensity of power graded from dark blue (lower magnitude) to dark red (higher magnitude). (B) Schematic describing indices of electrographic SE that were evaluated in these studies. Quantities determined include the maximum power, integrated power (the sum of red and green area), and the time to decrease from maximum power to 20% of the difference between maximum power and baseline power (C) Progression of SE shown by integrated power quantified at 12 h and 24 h after the onset of SE. No significant differences were noted between DMSO-treated and WP1066-treated rats during the progression of SE. Maximum power (D) and the degradation of maximum power (E) were quantified to evaluate the intensity and duration of SE. No significant differences were detected between treatment and vehicle groups. (SE+DMSO, n=3, 6 channels; SE+WP1066, n=4, 8 channels). Error bars, ±SEM.
Fig 4
Fig 4. WP1066 does not have acute effects on discrete EEG bandwidths during SE
Integrated power was measured for baseline periods prior to induction of SE, and periods 30 min, 1 h, 2 h, 4 h, and 6 h after onset of SE and administration of WP1066 (50 mg/kg at onset of SE, and a second dose of 50 mg/kg 45 minutes later) or DMSO for (A) delta, (B) theta, (C) alpha, (D) 13–30 Hz, (E) 30–50 Hz, and (F) 50–70 Hz bandwidths. No significant difference was present at any time point following drug administration or within any EEG bandwidth between signals from WP1066-treated rats and DMSO-treated rats. Potential significant differences were evaluated using a using one-way ANOVA with Tukey’s test for multiple comparisons. Representative traces sampled from a DMSO-treated rat (G1a-6a) and WP1066-treated rat (G1b-6b) at baseline (1 h prior to scopolamine administration), and at 30 min, 1 h, 2 h, 4 h, and 6 h following drug or vehicle injection demonstrate no alteration in the progression of pilocarpine-induced electrographic SE by treatment (SE+DMSO, n=3 rats; SE+WP1066, n=4 rats). Error bars, ±SEM.
Fig 5
Fig 5. WP1066 alters the severity of pilocarpine-induced epilepsy
(A) A representative trace of a spontaneous electrographic seizure in a rat with pilocarpine-induced epilepsy. (B) The mean number of spontaneous seizures per day (at daily intervals) over the course of two weeks after SE demonstrates a progressive increase in spontaneous seizure frequency over time after SE in vehicle (DMSO)-treated rats (n=18) relative to rats treated with 50 mg/kg WP1066 at onset of SE and 50 mg/kg WP1066 45 min later (n=10). Statistical analysis was carried out using a two-way ANOVA accounting for time and treatment effects. WP1066 significantly effected the progression of seizure frequency over the first two weeks after SE (***p<0.001), and time also impacted the frequency of daily seizures (p=0.0254) over the first two weeks. (C) Three and four weeks after SE, WP1066-treated rats (n=6) still exhibit a lower daily seizure frequency relative to DMSO-treated rats (n=8). Statistically significant differences were determined using a one-way ANOVA with Tukey’s test for multiple comparisons (*p<0.05). Box-and-whiskers plots. Upper and lower extremes of box are 75th and 25th percentiles. Whiskers extend from maximum value to minimum value. Line in box is plotted at median. (D) WP1066-treated rats demonstrate a significantly lower proportion of convulsive seizures (48.5 %) relative to DMSO-treated rats (76.6%). Statistically significant differences in the proportion of convulsive to non-convulsive seizures following WP1066 relative to vehicle treatment was determined using a Fischer’s exact test (**p<0.01). Error bars, ±SEM for all graphs except (C).
Fig 6
Fig 6. SE induces increases in STAT3-target genes
(A) Quantification of RT-PCR analysis of c-myc (CTRL, n=3; SE, n=4), cyclin D1 (CTRL, n=3; SE, n=4), bcl-2 (CTRL, n=3; SE, n=4), bcl-xl (CTRL, n=3; SE, n=4), mcl-1 (CTRL, n=3; SE, n=4), VEGF (CTRL, n=3; SE, n=4), and ICER (CTRL, n=5; SE, n=5) mRNA expression in DG 6 h after SE and (B) 24 h after SE (all genes, CTRL, n=3; SE, n=4). For RT-PCR reactions, each sample was run in triplicate. (A) SE caused a significant increase in ICER (p<0.001), c-myc (p<0.001), and mcl-1 (p<0.01) mRNA expression in DG of rats 6 h compared to CTRL. (B) SE induced significant increases in ICER (p<0.01), c-myc (p<0.01), cyclin D1 (p<0.01), bcl-xl (p<0.05), and mcl-1 (p<0.01) 24 h after SE. No significant difference in Bcl-2 or VEGF mRNA was observed at 6 h or 24 h after SE relative to levels in control rats, although a trend towards an increase was present. Expression of mRNA was normalized to cyclophilin and expressed as fold change compared to controls (CTRL, defined as 1). Significant differences were determined using an unpaired, Student’s t-test.
Fig 7
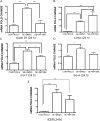
Fig 7. WP1066 inhibits SE-induced increases in STAT3-target genes
(A–E) RT-PCR quantification of cyclin D1, c-myc, mcl-1, bcl-xl, and ICER mRNA expression in dentate gyrus 24 h after SE and WP1066 or vehicle treatment (CTRL, n = 5; SE + DMSO, n = 6; SE + WP1066, n = 3 for all genes except ICER; and for ICER: CTRL, n=4; SE+DMSO, n=5; SE+WP1066, n=3). (A) Cyclin D1 mRNA expression was 58.3% lower (p < 0.001) inWP1066 treated rats 24 h after SE onset relative to vehicle treated rats. (B) WP1066 did not reverse increased expression of c-myc following status epilepticus in DG. (C) Mcl-1 mRNA expression was significantly reduced (p < 0.05) 24 h after SE in DG of WP1066-treated rats compared to vehicle-treated rats. (D) The administration of WP1066 at onset of SE did not significantly reduce the over-expression of bcl-xl or (E) ICER mRNA 24 h later in the DG. Expression of mRNA for all genes was normalized to cyclophilin and expressed as fold change compared to controls (CTL, defined as 1). Statistically significant differences in protein levels described above were determined using one-way ANOVAs with Tukey’s tests for multiple comparisons. Error bars, mean ± S.E.M.
Fig 8
Fig 8. WP1066 does not reduce or exacerbate SE-induced neuronal cell death in hippocampus
(A) Representative images of Fluorojade-B stained CA1, CA3, and dentate hilus subregions from a DMSO-treated (n=11) or WP1066-treated rat (n=9) 48 hs after SE. Acquired using 10X objective on Nikon Eclipse TE2000-U fluorescent microscope. Calibration bars, 200 μm. Mean Fluorojade-B positive neuronal cell densities (i.e., positively stained neuronal cells per mm2) averaged across a 1-in-20 series of serially sectioned and stained coronal sections (twenty 12-μm sections per rat) did not differ between WP1066-treated rats and DMSO-treated rats in (B) CA1, (C) CA3, or (D) dentate hilus. Potential statistically significant differences were determined using Mann-Whitney test. Box-and-whiskers plots, upper and lower extremes of box are 75th and 25th percentiles. Whiskers extend from maximum value to minimum value. Line in box is plotted at median.

References

    1. Aaronson DS, Horvath CM. A road map for those who don’t know JAK-STAT. Science. 2002;296:1653–5. - PubMed
    1. Arbour N, et al. Mcl-1 is a key regulator of apoptosis during CNS development and after DNA damage. J Neurosci. 2008;28:6068–78. - PMC - PubMed
    1. Azuma Y, et al. Particular nuclear transcription factors responsive to systemic administration of kainic acid in murine brain. Neurochem Int. 1996;29:289–99. - PubMed
    1. Balish M, et al. Seizure frequency in intractable partial epilepsy: a statistical analysis. Epilepsia. 1991;32:642–9. - PubMed
    1. Bauer J, Burr W. Course of chronic focal epilepsy resistant to anticonvulsant treatment. Seizure. 2001;10:239–46. - PubMed

Publication types

MeSH terms