Multicenter Study
. 2014 Jun;69(6):621-32.
doi: 10.1093/gerona/glt136. Epub 2013 Sep 19.

A clinical frailty index in aging mice: comparisons with frailty index data in humans

Affiliations
Multicenter Study

A clinical frailty index in aging mice: comparisons with frailty index data in humans

Jocelyne C Whitehead et al. J Gerontol A Biol Sci Med Sci. 2014 Jun.

Abstract

We previously quantified frailty in aged mice with frailty index (FI) that used specialized equipment to measure health parameters. Here we developed a simplified, noninvasive method to quantify frailty through clinical assessment of C57BL/6J mice (5-28 months) and compared the relationship between FI scores and age in mice and humans. FIs calculated with the original performance-based eight-item FI increased from 0.06 ± 0.01 at 5 months to 0.36 ± 0.06 at 19 months and 0.38 ± 0.04 at 28 months (n = 14). By contrast, the increase was graded with a 31-item clinical FI (0.02 ± 0.005 at 5 months; 0.12 ± 0.008 at 19 months; 0.33 ± 0.02 at 28 months; n = 14). FI scores calculated from 70 self-report items from the first wave of the Survey of Health, Ageing and Retirement in Europe were plotted as function of age (n = 30,025 people). The exponential relationship between FI scores and age (normalized to 90% mortality) was similar in mice and humans for the clinical FI but not the eight-item FI. This noninvasive FI based on clinical measures can be used in longitudinal studies to quantify frailty in mice. Unlike the performance-based eight-item mouse FI, the clinical FI exhibits key features of the FI established for use in humans.

Keywords: Deficit accumulation; Deficit index; Frailty index; Senescence..


Figures

Figure 1.
Figure 1.
Kaplan–Meier survival curve for mortality in C57BL/6J female mice. Mice were aged in the Carlton Animal Care Facility at Dalhousie University. Mortality occurred when mice died unexpectedly or were euthanized due to illness. The ages of mice used in the present study are indicated (n = 293 female mice).
Figure 2.
Figure 2.
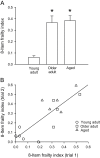
Scores obtained with the eight-item frailty index. (A) Mean (± SEM) eight-item frailty index scores were higher in both older age groups compared with young adults. (B) Scores from trial #1 were plotted against scores from trial #2. These data were a good fit to a straight line (r 2 = .67; p = .0003; n = 5 young adult mice, 4 older adult mice, and 5 aged mice). *Indicates significantly different from young adults (p < .05).
Figure 3.
Figure 3.
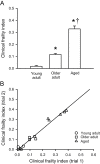
Scores obtained with the clinical frailty index. (A) Mean (± SEM) clinical frailty index scores increased with age. (B) The clinical frailty index scores from trial #1 were plotted against those from trial #2. These data were fitted with a linear regression (r 2 = .97; p < .0001; n = 5 young adult mice, 4 older adult mice, and 5 aged mice). *Indicates significantly different from young adults; †Indicates significantly different from older adults (p < .05).
Figure 4.
Figure 4.
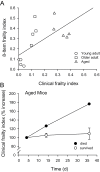
Comparison of the eight-item frailty and clinical frailty indices. (A) The scores for the eight-item frailty index were plotted as a function of the clinical frailty index scores. A regression line fitted through these data has an r 2 value of .43 (p = .01). (B) The clinical frailty index was repeated on three separate trials in the oldest group. For 4/5 mice, the relationship showed little change with time (open symbols). However, one mouse that died 2 days after the final trial (filled symbols) showed a marked increase in the clinical frailty index.
Figure 5.
Figure 5.
Comparison of the relationship between the frailty index and age in mice and humans. (A) Frailty index scores from the Survey of Health, Ageing and Retirement in Europe survey were plotted as function of age fit with an exponential function. Frailty increased exponentially with age (r 2 = .97; n = 30,025 people). (B) Frailty index scores for the eight-item frailty index (open symbols) and the clinical frailty index (filled symbols) were plotted as a function of age and fit with an exponential function (n = 14 mice). The clinical frailty index data were well described by an exponential function (r 2 = .91), but the eight-item frailty index data were not (r 2 = .49). (C) When age was normalized to the 90% mortality level in each group, the relationship between the frailty index and age was similar in mice and humans. (D) The natural logarithm frailty index was plotted as a function of age. The slopes of the regression lines through these data, which represent the rate of deficit accumulation, were similar in mice and humans although analysis of covariance showed that the slope was significantly higher in mice than in humans.

Similar articles

Cited by

References

    1. Mitnitski AB, Mogilner AJ, Rockwood K. Accumulation of deficits as a proxy measure of aging. Sci World J. 2001;1:323–336 - PMC - PubMed
    1. Howlett SE, Rockwood K. New horizons in frailty: ageing and the deficit-scaling problem. Age Ageing. 2013;42:416–423 - PubMed
    1. Rockwood K, Fox RA, Stolee P, Robertson D, Beattie BL. Frailty in elderly people: an evolving concept. CMAJ. 1994;150:489–495 - PMC - PubMed
    1. Clegg A, Young J, Iliffe S, Rikkert MO, Rockwood K. Frailty in elderly people. Lancet. 2013;381:752–762 - PMC - PubMed
    1. Kirkland JL, Peterson C. Healthspan, translation, and new outcomes for animal studies of aging. J Gerontol A Biol Sci Med Sci. 2009;64:209–212 - PMC - PubMed

Publication types