
A spastic paraplegia mouse model reveals REEP1-dependent ER shaping

Christian Beetz et al. J Clin Invest. 2013 Oct.

Erratum in

  • J Clin Invest. 2014 Jun 2;124(6):2809

Abstract

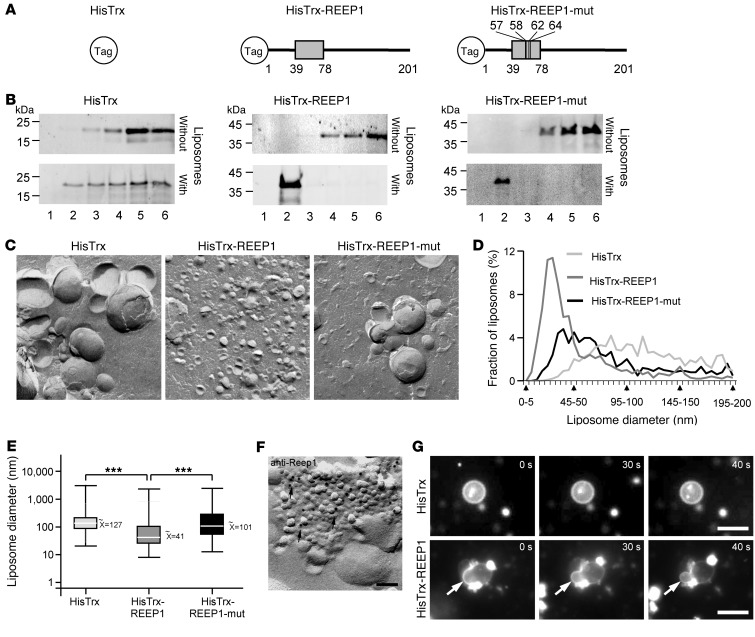
Axonopathies are a group of clinically diverse disorders characterized by the progressive degeneration of the axons of specific neurons. In hereditary spastic paraplegia (HSP), the axons of cortical motor neurons degenerate and cause a spastic movement disorder. HSP is linked to mutations in several loci known collectively as the spastic paraplegia genes (SPGs). We identified a heterozygous receptor accessory protein 1 (REEP1) exon 2 deletion in a patient suffering from the autosomal dominantly inherited HSP variant SPG31. We generated the corresponding mouse model to study the underlying cellular pathology. Mice with heterozygous deletion of exon 2 in Reep1 displayed a gait disorder closely resembling SPG31 in humans. Homozygous exon 2 deletion resulted in the complete loss of REEP1 and a more severe phenotype with earlier onset. At the molecular level, we demonstrated that REEP1 is a neuron-specific, membrane-binding, and membrane curvature-inducing protein that resides in the ER. We further show that Reep1 expression was prominent in cortical motor neurons. In REEP1-deficient mice, these neurons showed reduced complexity of the peripheral ER upon ultrastructural analysis. Our study connects proper neuronal ER architecture to long-term axon survival.


Figures

Figure 1
Figure 1. Lack of REEP1 exon 2 is associated with spastic paraplegia in humans and causes a severe motor phenotype in mice.
(A) MLPA-based screening of genomic DNA from an HSP index patient for copy number alterations in REEP1. The assay targets exons 3–6 with single probes, and exons 1, 2, and 7 with 2 or 3 probes each (ex1-1, ex1-2, etc.). Relative MLPA signals of approximately 1.0 indicate a normal diploid copy number (gray bars), whereas signals of approximately 0.5 (black bars) indicate a heterozygous genomic deletion. (B) Alignment of REEP1 intron 1 and intron 2 sequences with the sequence of the fusion allele. The box highlights the microhomology of 3 bp at the junction and the exclamation points denote nucleotide identity. (C) Strategy of Reep1 exon 2 deletion in mice. Wild-type locus (top schematic); the thick horizontal line marks the genomic region used for the targeting construct. The targeted locus is shown in the middle schematic, and the targeted locus after Cre-mediated exon 2 excision is shown in the bottom schematic. Numbered black squares: exons; triangles: loxP sites; NEO: neomycin selection cassette; BamHI, EcoRI, SmaI, SalI: restriction sites used for cloning. (D) Western blot analysis of brain lysates from Reep1+/+ and Reep1–/– mice using affinity-purified anti-REEP1 antibodies shows the absence of REEP1 protein in Reep1–/– mice. (E) Sixteen-month-old Reep1–/– mice suffer from gait abnormalities (see also Supplemental Videos 1 and 2). Note the broad-based positioning of the hind limbs, the kyphotic posture, and that neither the hind body nor the tail is properly lifted.
Figure 2
Figure 2. The REEP1 knockout phenotype is progressive, dose-dependent, and associated with a neurodegenerative rather than a neurodevelopmental pathology of upper motor neuron axons.
(A) Measurement of the foot-base angle. Shown are images of 20-week-old mice immediately prior to hind paw lifting. (B) Genotype dependence of foot-base angle over time. Error bars represent the SEM. *P < 0.05 (two-way ANOVA). (C) Semithin sections of the corticospinal tract in the spinal cord of 30-week-old mice at the lumbar level. Arrow and asterisk denote pathological structures, which are interspersed between morphological intact axons of Reep1–/– but not Reep+/+ mice. Scale bars: 1 μm. (D) Ultrastructural characterization of pathologies as highlighted in C. Dark structures are packed with electron-dense material (left panel); vacuolar structures are regions devoid of cellular material (right panel). The presence of myelin sheaths (arrowheads) indicates an axonal origin. Scale bars: 400 nm. (E) Neuronal cell bodies in the motor cortices of 13-month-old Reep1+/+ and Reep1–/– mice were identified by NeuN immunoreactivity. Scale bars: 200 μm. (F) Layer-wise quantification revealed no neuron loss in Reep1–/– mice. Error bars represent the SEM. (G) Lower motor neurons are not involved as judged from CMAPs upon sciatic nerve stimulation recorded from the musculus triceps surae. Error bars represent the SEM. (H) Cortical neurons obtained from P1 pups and cultured for 3 days. Neurites were visualized with phalloidin (Phl). Axons were labeled by the pan-axonal neurofilament marker SMI312 (SMI). Scale bars: 50 μm. (I) Quantification of the length of the longest axonal projection of each neuron. Error bars represent the SEM.
Figure 3
Figure 3. Reep1 expression is neuron specific and particularly strong in cortical upper motor neurons.
(A) Autoradiography of in situ hybridization of an E18.5 murine sagittal embryo section using a Reep1-specific probe. ca, caudal; cr, cranial; d, dorsal; v, ventral. Scale bar: 3 mm. (B) Western blot analyses of lysates of several organs from 4-month-old wild-type mice show REEP1 expression in the brain. Lysates from primary cortical cultures (P1) reveal expression in neurons but not in glial cells. (C) Schematic of a coronal section of an adult mouse brain at bregma +0.7 mm. cc, corpus callosum; cx, cortex; lv, lateral ventricle. Box depicts area displayed in D and E. (D) Nissl staining of a section of a 4-month-old wild-type mouse. pma, primary motor area; sma, secondary motor area. Arrowheads show the area borders. Scale bars: 500 μm. (E) In situ hybridization with a Reep1-specific probe on the section adjacent to the section shown in D. Scale bar: 500 μm. (F) Magnification of the primary motor area. Note the particularly strong labeling of cells in layer V of the primary motor cortex (i.e., upper motor neurons). Scale bar: 200 μm.
Figure 4
Figure 4. REEP1 is enriched in cellular membranes that contain the ER protein RTN4.
(A) Immunoblotting of subcellular fractions of murine brain lysates. TIM23: mitochondrial marker; actin served as a loading control. (B) Western blot analyses of REEP1, RTN4, and γ-adaptin after further subfractionation of the REEP1-containing postmitochondrial fractions using iodixanol-gradient centrifugation. (C) Quantification of the data shown in B (n = 4). REEP1 cofractionates with the ER marker RTN4 but not with γ-adaptin, a marker for the trans-Golgi. Error bars represent the SEM.
Figure 5
Figure 5. REEP1 binds and curves membranes in vitro.
(A) Constructs used for liposome-binding assays. The hydrophobic region encompassing residues 39–78 of REEP1 is marked (gray box). The positions of hydrophobic residues mutated to serines in HisTrx-REEP1-mut are indicated. (B) Liposome cofloatation assays. Proteins were detected using anti-HisTrx antibodies in immunoblots of sucrose gradient fractions 1 (top) to 6 (bottom). Tagged REEP1 and REEP1-mut, but not the tag alone, floated with liposomes in fraction 2. (C) TEM images of freeze-fractured incubations of liposomes with the indicated recombinant proteins. Scale bars: 200 nm. (D) Distribution of liposome diameters observed by TEM of freeze-fractured liposome incubations. Note that incubation with REEP1 leads to a pronounced increase in the relative numbers of 20- to 40-nm structures, the frequencies of which are strongly diminished upon incubation with HisTrx-REEP1-mut and are largely absent in the control incubations. (E) Box plots of the full set of data partially presented in C. Note that the y axis is logarithmic. ***P < 0.001 (one-way ANOVA). Boxes contain 50% of the values; minimal, maximal, and median values are marked by vertical lines. (F) High-resolution TEM analysis of freeze-fractured liposomes incubated with REEP1 and immunogold labeled for REEP1 shows REEP1 at positively curved membranes of predominantly small liposomes (arrows). Scale bar: 80 nm. (G) Sequential video frames of liposomes incubated with HisTrx control protein and HisTrx-REEP1 (taken from Supplemental Videos 3 and 4). Arrows indicate the constriction of a large liposome into two smaller, stronger curved membrane structures upon addition of HisTrx-REEP1. Scale bars: 5 μm.
Figure 6
Figure 6. REEP1 deficiency results in a dose-dependent reduction of the complexity of the peripheral ER but not of the nuclear envelope in neurons in the primary motor cortex.
(A) Representative TEM images of neuronal somata in the primary motor cortex of Reep+/+ and Reep1–/– mice. The cytoplasm is colored in yellow, the nucleus in blue, and the ER in red. Scale bars: 2 μm for whole-cell images and 400 nm for insets. (BG) Quantitative evaluations (mean ± SEM) of nuclear envelope and peripheral ER parameters in TEM sections of neuronal somata in the primary motor cortex of Reep1+/+, Reep1+/–, and Reep1–/– mice (4 animals per genotype, 12 cells per animal). Neither the length of the nuclear envelope (B), its sphericity (C), nor the number of nuclear pockets observed per cell section (D) differed between genotypes. Although the sum of the length of all peripheral ER structures per cell section was unaltered (E), a REEP1 dose–dependent increase was observed in the average length of individual ER structures (F) associated with a decrease in the number of individual ER structures per cell section (G). *P < 0.05 (one-way ANOVA).

Comment in

References

    1. Goldberg JL. How does an axon grow? Genes Dev. 2003;17(8):941–958. doi: 10.1101/gad.1062303. - DOI - PubMed
    1. Zuchner S, Vance JM. Emerging pathways for hereditary axonopathies. J Mol Med. 2005;83(12):935–943. doi: 10.1007/s00109-005-0694-9. - DOI - PubMed
    1. Harding AE. Hereditary spastic paraplegias. Semin Neurol. 1993;13(4):333–336. doi: 10.1055/s-2008-1041143. - DOI - PubMed
    1. Schule R, Schols L. Genetics of hereditary spastic paraplegias. Semin Neurol. 2011;31(5):484–493. doi: 10.1055/s-0031-1299787. - DOI - PubMed
    1. Blackstone C. Cellular pathways of hereditary spastic paraplegia. Annu Rev Neurosci. 2012;35:25–47. doi: 10.1146/annurev-neuro-062111-150400. - DOI - PMC - PubMed

Publication types

MeSH terms

Substances