. 2013 Oct;123(10):4219-31.
doi: 10.1172/JCI63492. Epub 2013 Sep 24.

Renal β-intercalated cells maintain body fluid and electrolyte balance

Renal β-intercalated cells maintain body fluid and electrolyte balance

Victor Gueutin et al. J Clin Invest. 2013 Oct.

Abstract

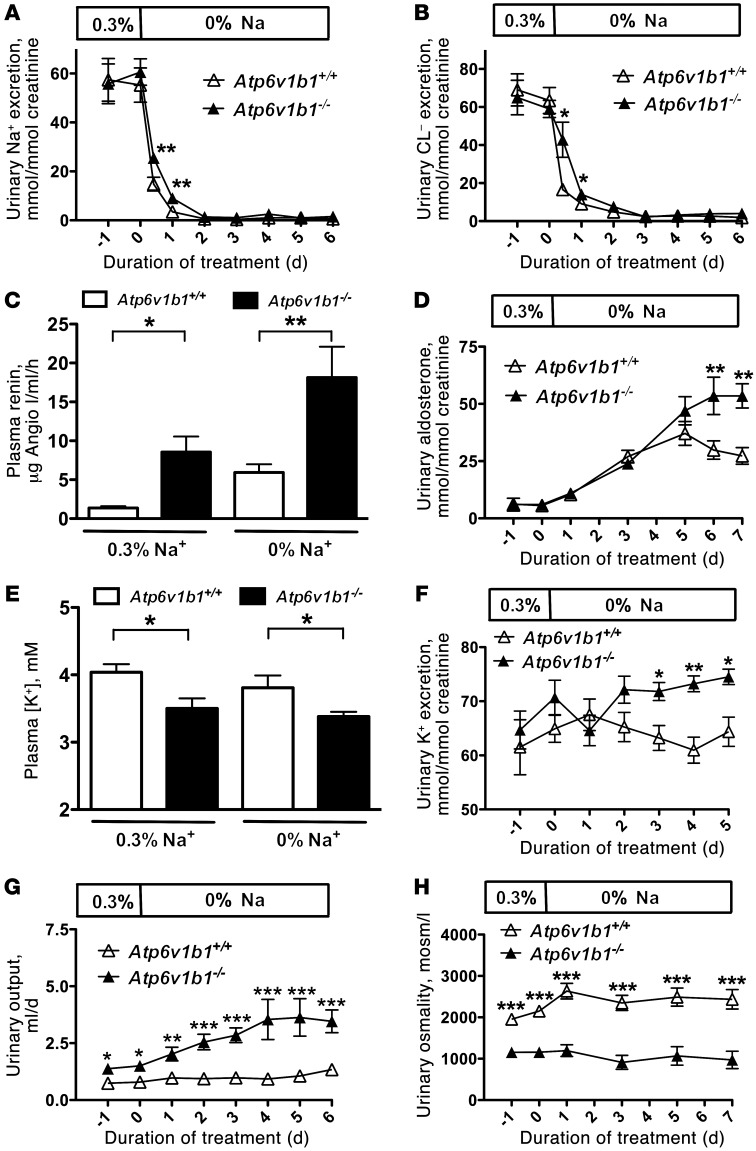
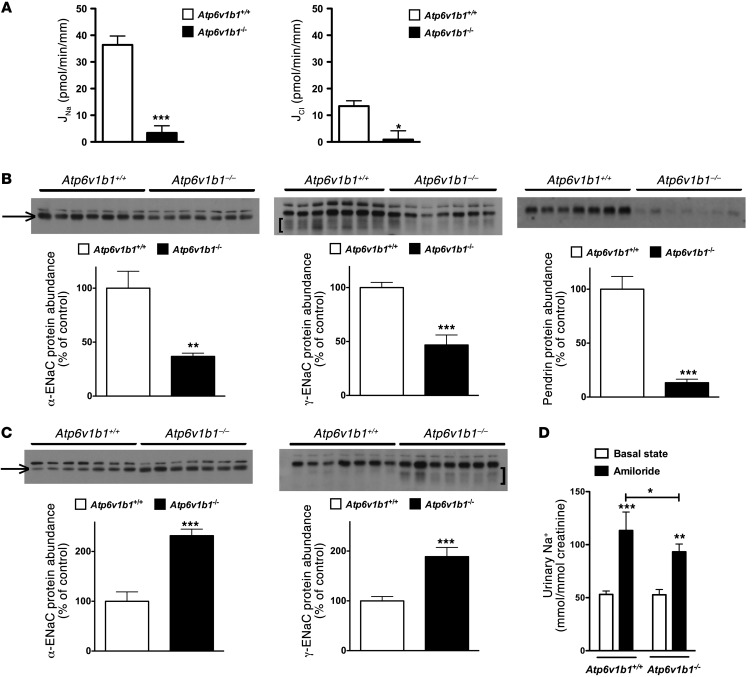
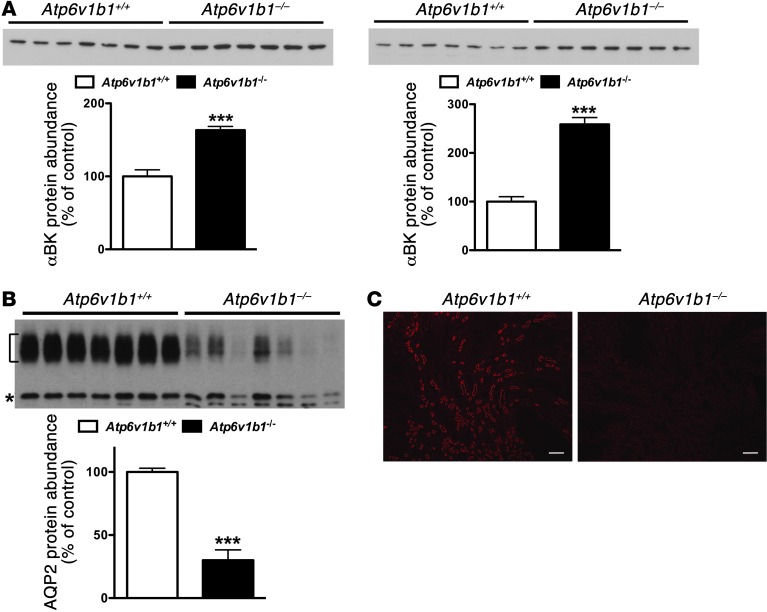
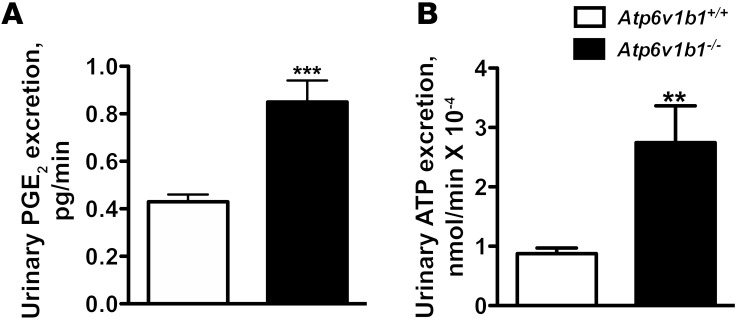
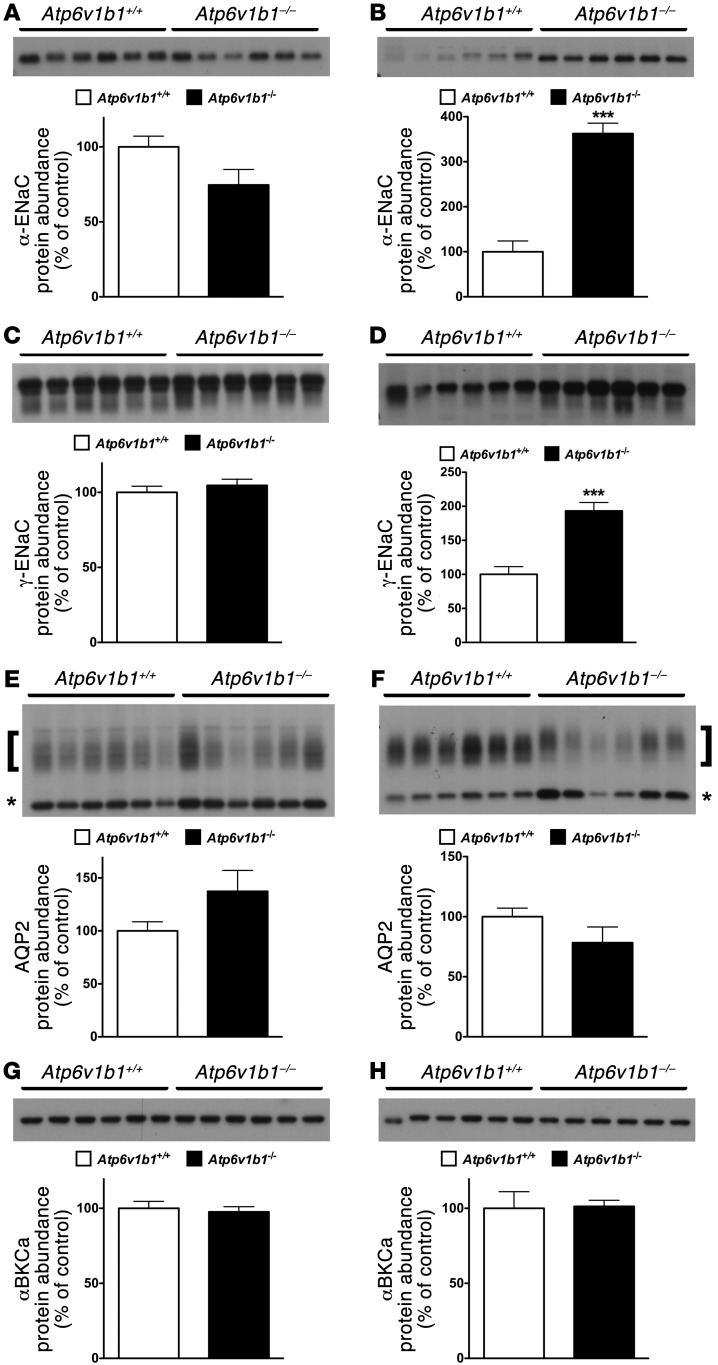
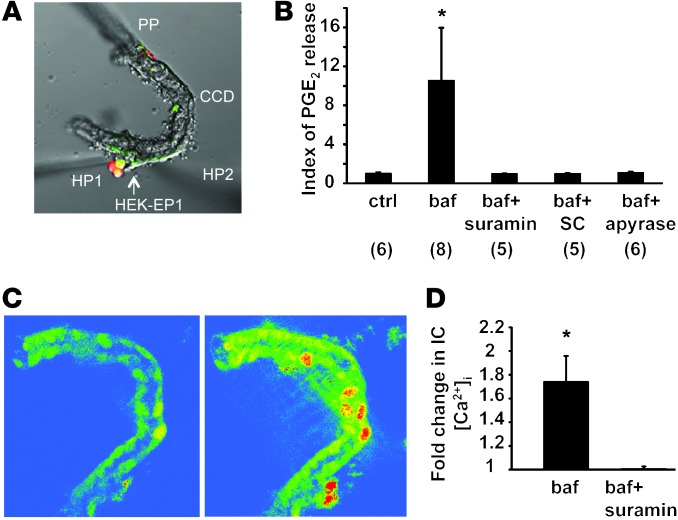
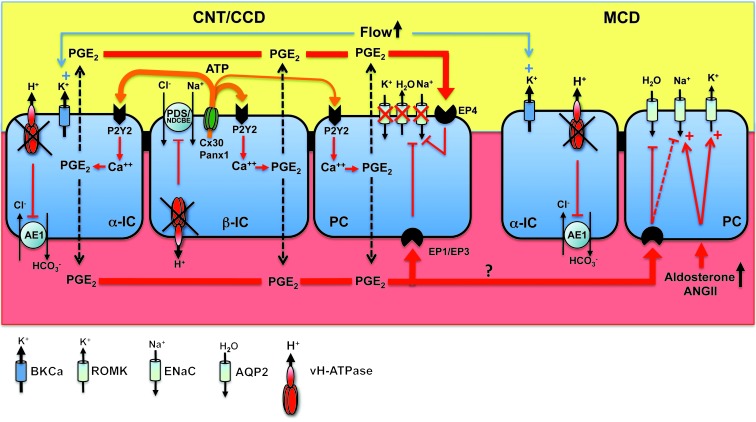
Inactivation of the B1 proton pump subunit (ATP6V1B1) in intercalated cells (ICs) leads to type I distal renal tubular acidosis (dRTA), a disease associated with salt- and potassium-losing nephropathy. Here we show that mice deficient in ATP6V1B1 (Atp6v1b1-/- mice) displayed renal loss of NaCl, K+, and water, causing hypovolemia, hypokalemia, and polyuria. We demonstrated that NaCl loss originated from the cortical collecting duct, where activity of both the epithelial sodium channel (ENaC) and the pendrin/Na(+)-driven chloride/bicarbonate exchanger (pendrin/NDCBE) transport system was impaired. ENaC was appropriately increased in the medullary collecting duct, suggesting a localized inhibition in the cortex. We detected high urinary prostaglandin E2 (PGE2) and ATP levels in Atp6v1b1-/- mice. Inhibition of PGE2 synthesis in vivo restored ENaC protein levels specifically in the cortex. It also normalized protein levels of the large conductance calcium-activated potassium channel and the water channel aquaporin 2, and improved polyuria and hypokalemia in mutant mice. Furthermore, pharmacological inactivation of the proton pump in β-ICs induced release of PGE2 through activation of calcium-coupled purinergic receptors. In the present study, we identified ATP-triggered PGE2 paracrine signaling originating from β-ICs as a mechanism in the development of the hydroelectrolytic imbalance associated with dRTA. Our data indicate that in addition to principal cells, ICs are also critical in maintaining sodium balance and, hence, normal vascular volume and blood pressure.


Figures

Figure 1
Figure 1. Effects of dietary NaCl restriction and renal K+ and water handling in Atp6v1b1–/– mice.
(A) Time course of renal excretion of Na+ in Atp6v1b1–/– and Atp6v1b1+/+ mice fed a normal-salt diet and then switched to a NaCl-restricted diet. (B) Time course of renal Cl excretion. (C) Plasma renin concentration was measured on a normal-salt diet and after 6 days of NaCl restriction. (D) Time course of urinary excretion of aldosterone. (E) Plasma [K+] was measured in Atp6v1b1–/– and Atp6v1b1+/+ mice fed a normal-salt diet or after 6 days of NaCl restriction. (F) Time course of renal K+ excretion when animals used for measurements of plasma [K+] shown in E were switched from normal to NaCl-restricted diet. (G) Time course of urine output. (H) Time course of urine osmolality. Data are presented as means ± SEM; n = 8 for Atp6v1b1+/+ and n = 7 for Atp6v1b1–/–. Statistical significance was assessed using an unpaired Student’s t test. *P < 0.05, **P < 0.01, and ***P < 0.001 vs. Atp6v1b1+/+.
Figure 2
Figure 2. Differential effects of Atp6v1b1 disruption on the cortical and MCD.
(A) Effects of Atp6v1b1 disruption on NaCl transport in the CCD. JNa and JCl were measured in CCDs isolated from Atp6v1b1+/+ mice and Atp6v1b1–/– mice fed a salt-depleted diet for 2 weeks. n = 5–7 tubules from different mice in each group. *P < 0.05. ***P < 0.001, 2-tailed unpaired Student’s t test. (B) Effects of Atp6v1b1 disruption on ENaC and pendrin expression in the CCD. α-ENaC, γ-ENaC, and pendrin protein abundance were assessed with Western blot of protein extracted from the renal cortex of Atp6v1b1–/– and Atp6v1b1+/+ mice. (C) Effects of Atp6v1b1 disruption on ENaC expression in the MCD. α-ENaC and γ-ENaC protein abundance was assessed with Western blot of protein extracted from the renal medulla of Atp6v1b1–/– and Atp6v1b1+/+ mice. (B and C) Lanes were loaded with a protein sample from different mice, with 15 μg (B) and 5 μg (C) proteins per lane; equal loading confirmed by parallel Coomassie-stained gels. The α-ENaC antibody recognized 2 bands at 90 and 100 kDa. Bands at 90 kDa (arrows) were not detected in kidneys from α-ENaC knockout mice, and were quantified. The γ-ENaC antibody recognized a doublet band at 85–80 kDa and a large band centered around 70 kDa (brackets). Bar graphs summarize densitometric analyses of doublet 85-kDa and broad 70-kDa bands. *P < 0.05, **P < 0.01, ***P < 0.001 vs. Atp6v1b1+/+, unpaired Student’s t test. (D) Effect of amiloride on urinary Na+ excretion in Atp6v1b1+/+ and Atp6v1b1–/– mice. Urines were collected before and 6 hours after amiloride injection (1.45 mg/kg BW) into Atp6v1b1+/+ and Atp6v1b1–/– mice. *P < 0.05 vs. Atp6v1b1+/+ after amiloride injection; **P < 0.01, ***P < 0.001 vs. basal state; 1-way ANOVA.
Figure 3
Figure 3. BKCa and AQP2 protein expression assessed in Atp6v1b1–/– and Atp6v1b1+/+ mice.
(A) Western blot for α-BKCa on renal cortex (left) or renal medulla (right). Each lane was loaded with a protein sample from a different mouse; 15 μg and 5 μg proteins were loaded per gel lane for cortical samples and medullary samples, respectively. (B) Western blot for AQP2 on renal medulla. Bracket and asterisk show the glycosylated 37-kDa and the unglycosylated 25-kDa forms of AQP2, respectively. Each lane was loaded with a protein sample from a different mouse; 5 μg proteins were loaded per gel lane. Equal loading was confirmed by parallel Coomassie-stained gels. Bar graphs summarize densitometric analyses. For AQP2, bar graphs summarize bracketed and asterisked bands. ***P < 0.01 vs. Atp6v1b1+/+, unpaired Student’s t test. (C) Immunohistochemistry of kidney sections showing AQP2 staining in renal medulla from Atp6v1b1+/+ and Atp6v1b1–/– mice. Scale bars: 250 μm.
Figure 4
Figure 4. Effects of Atp6v1b1 disruption on urine excretion of PGE2 and ATP.
(A and B) Urinary excretion of PGE2 (A) and ATP (B) in Atp6v1b1–/– and Atp6v1b1+/+ mice. Data are means ± SEM. For PGE2, n = 26–27 mice in each group. For ATP, n = 15 mice in each group. **P < 0.01 vs. Atp6v1b1+/+; ***P < 0.001 vs. Atp6v1b1+/+, unpaired Student’s t test with Welch’s correction.
Figure 5
Figure 5. Effects of 2 days of indomethacin injection on the protein abundance of ENaC, AQP2, and BKCa in Atp6v1b1–/– and Atp6v1b1+/+ mice.
(AH) Protein abundance of α-ENaC subunit (A and B), γ-ENaC subunit (C and D), AQP2 (E and F), and α-BKCa (G and H) was assessed with Western blot analysis of protein extracted from renal cortex (A, C, E, and G) or medulla (B, D, F, and H) of Atp6v1b1–/– and Atp6v1b1+/+ mice after 2 days of indomethacin injections. Each lane was loaded with a protein sample from a different mouse; 15 μg and 5 μg proteins were loaded per gel lane for cortical samples and medullary samples, respectively. Equal loading was confirmed with parallel Coomassie-stained gels. Bar graphs summarize densitometric analyses. ***P < 0.001 vs. Atp6v1b1+/+. In A and B, arrow indicates the 90-kDa–specific band for α-ENaC. In E and F, bar graphs summarize bands indicated by brackets (glycosylated 37-kDa form of AQP2) and asterisks (unglycosylated 25-kDa form of AQP2).
Figure 6
Figure 6. Paracrine signaling in the isolated microperfused CCD.
(A and B) Measurement of bafilomycin A1–induced luminal PGE2 release in the isolated microperfused CCD using a biosensor technique. (A) HEK cells overexpressing the EP1 receptor were loaded with Fluo-4 and Fura Red, held by a holding pipette (HP1), and positioned in the lumen of the split-open microperfused CNT/CCD, in contact with the tubular fluid. PP, CCD perfusion pipette; HP2, holding pipette to keep the tubule end in position. DIC image and fluorescence overlay are shown. (B) Summary of PGE2 biosensor responses. Fold change in Fluo-4/Fura Red fluorescence ratio is shown as index of PGE2 release. Addition of 40 nM bafilomycin (baf) to the bathing solution caused elevation in HEK-EP1 biosensor cell calcium indicating luminal PGE2 release. The effects of bafilomycin were prevented by the addition of the purinergic (ATP) receptor blocker suramin (50 μM) to the tubular perfusate. Similarly, the selective PGE2 EP1 receptor inhibitor SC51322 (SC; 10 μM) added to the luminal perfusate blocked bafilomycin-induced biosensor responses indicating PGE2 specificity. Addition of the ATP scavenger apyrase (50 U/ml) to the tubular perfusate also abolished PGE2 biosensor responses consistent with its dependence on luminal ATP release. *P < 0.05 bafilomycin vs. baseline (ctrl). Numbers per group are indicated in parentheses. (C and D) Fluorescence imaging of bafilomycin-induced purinergic calcium signaling in the isolated microperfused CCD. CCDs were perfusion-loaded with Fluo-4 and Fura Red. (C) Gradient pseudocolor images show CCD [Ca2+]i levels before (left) and after (right) addition of 40 nM bafilomycin to bathing solution. Bafilomycin caused significant elevations in CCD [Ca2+]i, most significantly in ICs, which were identified based on anatomical considerations (lower cell density and higher cell volume compared with PCs). (D) Summary of bafilomycin-induced changes in CCD [Ca2+]i. The purinergic (ATP) receptor blocker suramin added to the tubular perfusate (50 μM) abolished the effects of bafilomycin. *P < 0.05 bafilomycin vs. bafilomycin and suramin; n = 5/group.
Figure 7
Figure 7. Schematic description of the consequence of v-H+-ATPase dysfunction on Na+, K+, and water transport in the CNT/CCD and the MCD.
Atp6v1b1 disruption impairs both electroneutral Na+ absorption through β-ICs and ENaC-mediated Na+ absorption through the neighboring PCs. Local ATP/PGE2 signaling cascade is responsible for decreased ENaC protein and activity as well as AQP2 protein and contributes to Na+ and water losses, thereby promoting high tubular flow. ENaC inhibition in the CNT/CCD likely blocks K+ secretion through ROMK. In contrast, PCs in the MCD have a normal response to hyperaldosteronism (i.e. increased ENaC expression). Increased ENaC activity in the MCD is expected to favor K+ secretion through ROMK. High tubular flow activates BKCa potassium channels and K+ secretion, leading to renal K+ loss in Atp6v1b1–/– mice. Indeed, indomethacin, which reduced urinary flow and restored AQP2 protein levels in Atp6v1b1–/– mice, also normalized protein levels of BKCa and decreased urinary K+ excretion in Atp6v1b1–/– mice, leading to normal plasma potassium concentration.

Comment in

References

    1. Alper SL. Genetic diseases of acid-base transporters. Annu Rev Physiol. 2002;64:899–923. doi: 10.1146/annurev.physiol.64.092801.141759. - DOI - PubMed
    1. Wagner CA, Devuyst O, Bourgeois S, Mohebbi N. Regulated acid-base transport in the collecting duct. Pflugers Arch. 2009;458(1):137–156. doi: 10.1007/s00424-009-0657-z. - DOI - PubMed
    1. Alper SL, Natale J, Gluck S, Lodish HF, Brown D. Subtypes of intercalated cells in rat kidney collecting duct defined by antibodies against erythroid band 3 and renal vacuolar H+-ATPase. Proc Natl Acad Sci U S A. 1989;86(14):5429–5433. doi: 10.1073/pnas.86.14.5429. - DOI - PMC - PubMed
    1. Wagner CA, Finberg KE, Breton S, Marshansky V, Brown D, Geibel JP. Renal vacuolar H+-ATPase. Physiol Rev. 2004;84(4):1263–1314. doi: 10.1152/physrev.00045.2003. - DOI - PubMed
    1. Karet FE, et al. Mutations in the gene encoding B1 subunit of H+-ATPase cause renal tubular acidosis with sensorineural deafness. Nat Genet. 1999;21(1):84–90. doi: 10.1038/5022. - DOI - PubMed

Publication types

MeSH terms