

Clinical pharmacology quality assurance program: models for longitudinal analysis of antiretroviral proficiency testing for international laboratories
- PMID: 24052065
- PMCID: PMC3781596
- DOI: 10.1097/FTD.0b013e31828f5088
Clinical pharmacology quality assurance program: models for longitudinal analysis of antiretroviral proficiency testing for international laboratories
Abstract
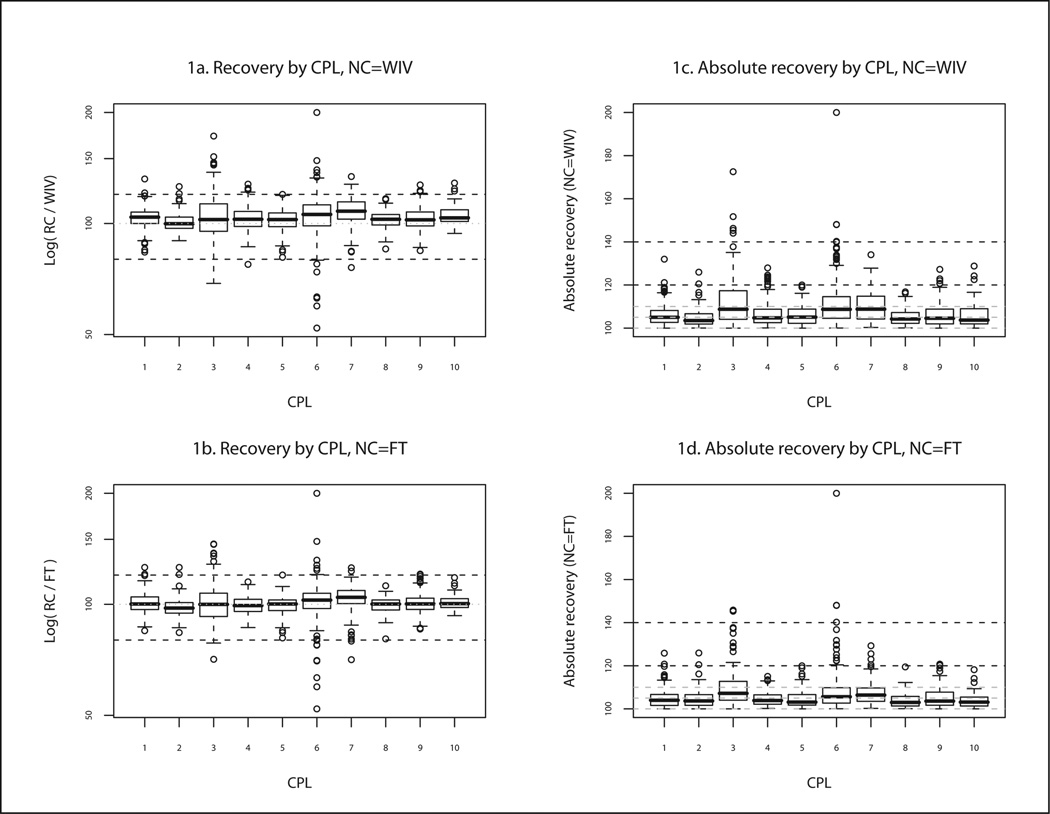
Among National Institutes of Health HIV Research Networks conducting multicenter trials, samples from protocols that span several years are analyzed at multiple clinical pharmacology laboratories (CPLs) for multiple antiretrovirals. Drug assay data are, in turn, entered into study-specific data sets that are used for pharmacokinetic analyses, merged to conduct cross-protocol pharmacokinetic analysis, and integrated with pharmacogenomics research to investigate pharmacokinetic-pharmacogenetic associations. The CPLs participate in a semiannual proficiency testing (PT) program implemented by the Clinical Pharmacology Quality Assurance program. Using results from multiple PT rounds, longitudinal analyses of recovery are reflective of accuracy and precision within/across laboratories. The objectives of this longitudinal analysis of PT across multiple CPLs were to develop and test statistical models that longitudinally: (1) assess the precision and accuracy of concentrations reported by individual CPLs and (2) determine factors associated with round-specific and long-term assay accuracy, precision, and bias using a new regression model. A measure of absolute recovery is explored as a simultaneous measure of accuracy and precision. Overall, the analysis outcomes assured 97% accuracy (±20% of the final target concentration of all (21) drug concentration results reported for clinical trial samples by multiple CPLs). Using the Clinical Laboratory Improvement Act acceptance of meeting criteria for ≥2/3 consecutive rounds, all 10 laboratories that participated in 3 or more rounds per analyte maintained Clinical Laboratory Improvement Act proficiency. Significant associations were present between magnitude of error and CPL (Kruskal-Wallis P < 0.001) and antiretroviral (Kruskal-Wallis P < 0.001).
Conflict of interest statement
No conflicts of interest are declared.
Figures
References
-
- Miller WG, Jones GR, Horowitz GL, Weykamp C. Proficiency testing/external quality assessment: current challenges and future directions. Clin Chem. 2011 Dec;57(12):1670–1680. - PubMed
-
- Droste JA, Koopmans PP, Hekster YA, Burger DM. TDM: therapeutic drug measuring or therapeutic drug monitoring? Ther Drug Monit. 2005 Aug;27(4):412–416. - PubMed
-
- Aarnoutse RE, Schapiro JM, Boucher CA, Hekster YA, Burger DM. Therapeutic drug monitoring: an aid to optimising response to antiretroviral drugs? Drugs. 2003;63(8):741–753. - PubMed
-
- Droste JA, Aarnoutse RE, Koopmans PP. Evaluation of antiretroviral drug measurements by an interlaboratory quality control program. J Acquir Immune Defic Syndr. 2003 Mar 1;32(3):287–291. - PubMed
Publication types
MeSH terms
Substances
Grants and funding
LinkOut - more resources
Full Text Sources
Other Literature Sources
Medical
