. 2013 Sep 19;4(9):e808.
doi: 10.1038/cddis.2013.318.

A novel extracellular role for tissue transglutaminase in matrix-bound VEGF-mediated angiogenesis

Affiliations

A novel extracellular role for tissue transglutaminase in matrix-bound VEGF-mediated angiogenesis

Z Wang et al. Cell Death Dis. .

Abstract

The importance of tissue transglutaminase (TG2) in angiogenesis is unclear and contradictory. Here we show that inhibition of extracellular TG2 protein crosslinking or downregulation of TG2 expression leads to inhibition of angiogenesis in cell culture, the aorta ring assay and in vivo models. In a human umbilical vein endothelial cell (HUVEC) co-culture model, inhibition of extracellular TG2 activity can halt the progression of angiogenesis, even when introduced after tubule formation has commenced and after addition of excess vascular endothelial growth factor (VEGF). In both cases, this leads to a significant reduction in tubule branching. Knockdown of TG2 by short hairpin (shRNA) results in inhibition of HUVEC migration and tubule formation, which can be restored by add back of wt TG2, but not by the transamidation-defective but GTP-binding mutant W241A. TG2 inhibition results in inhibition of fibronectin deposition in HUVEC monocultures with a parallel reduction in matrix-bound VEGFA, leading to a reduction in phosphorylated VEGF receptor 2 (VEGFR2) at Tyr¹²¹⁴ and its downstream effectors Akt and ERK1/2, and importantly its association with β1 integrin. We propose a mechanism for the involvement of matrix-bound VEGFA in angiogenesis that is dependent on extracellular TG2-related activity.


Figures
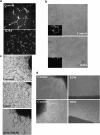
Figure 1
Figure 1
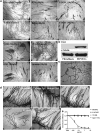
Effect of TG2 inhibitor R294 on endothelial tubule formation. (a) Inhibition of endothelial cord formation on Matrigel by R294. Representative image from three separate experiments. HUVECs seeded at a concentration of 15 000 cells per well in 12-well plates containing Matrigel and induced to form tubule like structures in EGM complemented medium in the presence of 100 μM R294 or vehicle control (0.01% DMSO) for 6 h. Cells were labelled with 2 μM Calcein AM for 15 min and were photographed using 484 nm excitation and 520 nm emission filter on a fluorescent microscope. (b) Inhibitory effect of R294 on HUVEC in collagen 3D culture. HUVECs (1 × 10⁵/well, in 48-well plates) were mixed with rat tail collagen solution (final concentration 1.5 mg/ml) with 50 μM TG2 inhibitor R294 or the vehicle control (0.01% DMSO) and allowed to gelify at 37 °C for 30 min. Endothelial culture medium in the presence or absence of 100 μM R294 or vehicle was added to the well. Following a 4-day culture period, representative images with and without R294 are shown using a bright-field microscope (n=3). (c and d) Endothelial vessel outgrowth from rat aorta ring in Matrigel or thin layer collagen. Rat aorta rings (n=4) were embedded in Matrigel (c) or a thin layer of rat tail collagen (d) and incubated with endothelial cell medium for 7 days in the presence of 100 μM R294 or vehicle (0.01% DMSO) as described in the Materials and Methods. The representative images were taken using a bright-field microscope
Figure 2
Figure 2
Effect of TG2 inhibition on endothelial tubule formation in fibroblasts and EC co-cultures. (a) After incubating the V2a AngioKit co-culture for 24 h, V2a Growth medium was introduced (day 1) in the absence or presence of either the irreversible inhibitors Z-DON, R294 or R283 at the concentrations shown, and replaced in fresh medium every other day for 12 days. Controls contained either complete growth media alone (untreated), or the respective inhibitor vehicle (DMSO, 0.01%). Suramin or VEGF was used for the negative and positive control, respectively. Cells were fixed in ethanol at day 12 and stained for CD31 antigen using an anti-mouse IgG secondary AP-conjugated antibody and visualised as described in the Materials and Methods. The tubule like structures were analysed by the TCS Cellworks AngioSys Image Analysis Software (ZHA-1800) (Supplementary Table S1), as described in the Materials and Methods. (b) The presence of TG2 in human fibroblasts and HUVECs. Western blotting was performed to detect the presence of TG2 in fibroblasts and HUVECs, separately. α-Tubulin was used as the equal loading control. (c) Co-culture of HUVEC and TG2−/− MEF. HUVECs were induced to undergo microtubule formation in the presence of TG2−/− fibroblasts using the growth media from the angiogenesis V2a Kit. Shown is the appearance of endothelial cell microtubules at day 14 revealed by immunostaining for CD31 antigen using anti-mouse IgG secondary alkaline phosphatase (AP)-conjugated antibody and visualised as described in the Materials and Methods.(d) Effect of different TG2-specific antibodies on endothelial cell tubule formation in the co-culture assay. Culture medium was supplemented with either the mouse monoclonal TG2 activity neutralising antibody (D11D12, 0.1 μg/ml), the commercial anti-TG2 antibodies Cub7402 (0.5 μg/ml) or TG100 (0.5 μg/ml) added to the co-culture system from day 1 (24 h after seeding). Controls consisted of either untreated cultures or isotype-matched IgG. After 12 days, the tubule formation was analysed as described in (a) (see Supplementary Table S1). (e) The effect of the antibodies D11D12, Cub7402 and TG100 on the extracellular crosslinking activity of TG2 in the co-culture angiogenesis assay. Cells at day 9 were incubated with various concentrations of the antibodies or isotype-matched control for 1 h at 37 °C in a 96-well microplate. Following this pre-incubation period, biotinylated cadaverine incorporation was measured as described in the Materials and Methods. Data show mean value±S.D. after background correction (n=3) for assays that contained 10 mM EDTA
Figure 3
Figure 3
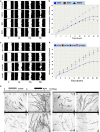
Migration of HUVECs on fibronectin in the presence of either TG2-specific inhibitors or specific antibodies. (a) HUVECs were seeded onto graduated 96-well plates pre-coated with fibronectin (5 μg/ml) and allowed to reach 90–95% confluence in the presence of EGM media. Following the different treatments, as indicated in the figure, cells were stimulated to migrate in the absence or presence of the TG2 inhibitor R294 (100 μM) and R283 (100 μM), with a net scratch using a multi-well wound healing devise to prevent direct damage to the coated surface. Cell migration was continuously monitored over a period of 18 h in the ESSEN IncuCyte instrument as shown in the graph below. The masked images are representative of the cell migration towards the wounded area at different time intervals, as indicated. (c) The same experiment as in (a) except the inactivating antibody (D11D12, 0.1 μg/ml) or the commercial anti-TG2 antibody Cub7402 or TG100 (0.5 μg/ml) or their isotype controls was added to the culture medium. (b and d) Cell migration was continuously monitored over a period of 18 h in the ESSEN IncuCyte instrument and the cell migration was quantified as the density of the wounded area over the time, using the ESSEN IncuCyte software. (e) Staged effect of TG2 inhibition on tubule formation in the co-culture assay. HUVEC co-cultures cultured for 12 days after adding of V2a Growth medium and treated with inhibitor vehicle (0.01% DMSO) used as the control (upper panels) or TG2 inhibitor R294. Treatments consisted of the addition of the R294 (50 μM) from day 1 to 12, added with fresh medium every other day, or addition of the inhibitor only during the first stage of the co-culture (from day 1 to 6), or only during the late stage (from day 6 to 12). Tubule formation was visualised and analysed as described in Figure 3 (Supplementary Table S1)
Figure 4
Figure 4
Manipulating TG2 expression in HUVECs affects tubule formation and cell migration. (a) Western blot analysis of TG2 expression levels in lysates of HUVEC-TG2wt and HUVEC-TG2kd (HUVECs transduced with TG2 scrambled or targeted shRNA) and (b) TG2 add back, either the active wt enzyme or the W241A mutant in the kd HUVECs. α-Tubulin was used as a loading control and ratio of band intensity for TG2 is shown below taken from three separate experiments. (c and d) Tubule formation of HUVECs expressing wt TG2, TG2kd or the TG2 mutants after reintroduction into the TG2kd cells. HUVEC-TG2wt, -TG2kd, -TG2ab, -TG2kd/W241A or TG2kd in the presence of exogenously added rhTG2 (0.25 μg/ml), induced to form tubule structures on Matrigel in complete EGM-2 medium as described in the Materials and Methods, for 6 h at 37 °C in 5% CO2. Cells (GFP, green) were photographed using an epifluorescent microscope as described in the Materials and Methods. (d) HUVECs as described in (c) (GFP, green), co-cultured with human dermal fibroblast as feeder cells in the enriched EGM medium for 12 days as described in the Materials and Methods. Images were taken as in (c). The tubule like structures shown were analysed by the TCS Cellworks AngioSys Image Analysis Software (ZHA-1800) (Supplementary Table S3), as described in the Materials and Methods using a bright-field microscope. (e) Scratch assay for migration of HUVEC-TG2wts and HUVEC-TG2kd on FN, in the absence or presence of exogenously added rhTG2 at different concentrations, analysed as in Figure 3
Figure 5
Figure 5
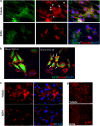
The effect of TG2 inhibition of HUVEC morphology and FN deposition. (a) Representative images (n=3) from monolayer HUVECs treated with 100 μM R294 or vehicle for 48 h and the actin cytoskeleton (green) and FAs (vinculin, red, as pointed out by the arrow heads) staining was performed and visualised as described in the Materials and Methods. Nuclear counterstaining of cells used 4, 6-diamidino-2-phenylindole (DAPI; blue). (b) Cytoskeletal organisation of HUVEC-TG2wt and HUVEC-TG2kd. Morphological comparison of the spreading ability of HUVEC-TG2wt and HUVEC-TG2kd, when assessed for actin stress fibre formation. HUVECs expressing the viral constructs (GFP, green colour) were plated on FN-coated cover slips in the presence of EGM complemented medium. TRITC-labelled phalloidin (red) was used to stain actin fibres and then examined by confocal microscopy as described in the Materials and Methods. (c) The effect of TG2 on ECM FN deposition by HUVECs. Representative image from HUVECs treated with 100 μM TG2 inhibitor R294 or vehicle for 48 h before immunostaining for extracellular FN as described in the Materials and Methods. Cells were counter stained with DAPI. The ECM FN was visualised using fluorescence microscopy as described in the Materials and Methods. (d) The inhibition of biotin-labelled FN deposition by R294 in HUVECs. Biotin-labelled FN 50 nM was added into HUVEC mono-cell layer as described in the Materials and Methods with 100 μM R294 or with the vehicle control. After a 48-h incubation period, the presence of biotin-labelled FN was detected using Cy5-conjugated Strep-Avidin and the fluorescence signal was visualised via confocal microscopy. Bar, 25 μm
Figure 6
Figure 6
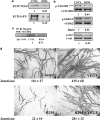
The effect of TG2 inhibition on VEGF deposition and signalling. (a) Reduction of matrix VEGF and FN by inhibition of TG2. HUVECs mono-cell culture treated with 100 μM R294 or 0.01% DMSO vehicle control for 48 h. The ECM fractions from HUVECs culture were collected and western blotted for VEGF, using a specific anti-VEGF antibody as described in the Materials and Methods. The deposition of biotin-labelled FN in the ECM after western blotting was detected by using HRP-conjugated Extr-Avidin and the ratio of the bands taken from three separate experiments is as shown.(b) The phosphorylation of VEGFR2, ERK1/2 and Akt in HUVECs is regulated by TG2. HUVECs mono-cell culture treated with R294 or DMSO vehicle were isolated after 48 h growth and the cell lysates used in western blotting to detect the phosphorylated VEGFR2 at Tyr1214, ERK1/2 (p-ERK1/2) and Akt (p-Akt). Total VEGFR2, ERK1/2 and Akt was used as the loading control as described in the Materials and Methods. The ratio of the bands taken from three separate experiments is as shown. (c) The inhibitory effect of R294 on the direct interaction between VEGFR2 and β1 integrin via co-immunoprecipitation. Anti-β1 integrin antibody was used to pull down the β1 integrin immuno-complex in the HUVECs with or without R294 treatment for 48 h, the presence of VEGFR2 was detected via western blotting by using anti-VEGFR2 antibody, while the rabbit IgG was used as the negative control. The ratio of the bands taken from three separate experiments. (d) Effect of R294 on VEGF-stimulated angiogenesis. Co-cultures were grown for 12 days either untreated, or in the presence of VEGF (2 ng/ml) or R294 (100 μM), or VEGF (2 ng/ml) plus R294 (100 μM). Shown is the appearance of endothelial cell tubes at day 12 revealed by the immunostaining for CD31, which was analysed by image analysis as in Figure 2 (Supplementary Table S1)
Figure 7
Figure 7
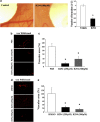
(a) Effect of TG2 inhibitor R294 on angiogenesis using the in vivo CAM assay. Chick embryo after 6 days of growth in the presence of R294 at100 μM or vehicle (0.01% DMSO) applied on disks in the same egg, as described in the Material and Methods. The accompanying histogram represents quantification of the vascular branches in presence or absence of the inhibitor R294. Bars represent the mean number of vascular branches in arbitrary units (AU)±S.D. (n=5 per group). Quantification was assisted by computer assisted analysis using ImageJ. *P<0.05.indicates difference from vehicle control (be). The effect of TG2 inhibition on in vivo angiogenesis in a mice Matrigel plug model. (b and d) Show the immunostaining of blood vessels using Von Willebrand as the angiogenesis marker in the presence of TG2 inhibitors R292 (b) and R294 (d) at the concentrations of 250 μM and 500 μM. The area of the blood vessels was quantified using Image J software and expressed as mean value±S.D. (n=5). (c and e) PBS and DMSO (0.01%) were used at the vehicle controls treatments for TG2 inhibitors R292 and R294, respectively. *P<0.05 indicates difference from vehicle control

Similar articles

Cited by

References

    1. Lieu C, Heymach J, Overman M, Tran H, Kopetz S. Beyond VEGF: inhibition of the fibroblast growth factor pathway and antiangiogenesis. Clin Cancer Res. 2011;17:6130–6139. - PMC - PubMed
    1. Hellberg C, Ostman A, Heldin CH. PDGF and vessel maturation. Recent Results Cancer Res. 2010;180:103–114. - PubMed
    1. Siemerink MJ, Augustin AJ, Schlingemann RO. Mechanisms of ocular angiogenesis and its molecular mediators. Dev Ophthalmol. 2010;46:4–20. - PubMed
    1. Finn RS, Zhu AX. Targeting angiogenesis in hepatocellular carcinoma: focus on VEGF and bevacizumab. Expert Rev Anticancer Ther. 2009;9:503–509. - PubMed
    1. Roodhart JM, Langenberg MH, Witteveen E, Voest EE. The molecular basis of class side effects due to treatment with inhibitors of the VEGF/VEGFR pathway. Curr Clin Pharmacol. 2008;3:132–143. - PubMed

Publication types

MeSH terms