Review
. 2013 Oct;14(10):692-702.
doi: 10.1038/nrg3604.

Recent human adaptation: genomic approaches, interpretation and insights

Affiliations
Review

Recent human adaptation: genomic approaches, interpretation and insights

Laura B Scheinfeldt et al. Nat Rev Genet. 2013 Oct.

Abstract

The recent availability of genomic data has spurred many genome-wide studies of human adaptation in different populations worldwide. Such studies have provided insights into novel candidate genes and pathways that are putatively involved in adaptation to different environments, diets and disease prevalence. However, much work is needed to translate these results into candidate adaptive variants that are biologically interpretable. In this Review, we discuss methods that may help to identify true biological signals of selection and studies that incorporate complementary phenotypic and functional data. We conclude with recommendations for future studies that focus on opportunities to use integrative genomics methodologies in human adaptation studies.


Figures

Figure 1
Figure 1. Genetic signatures of positive selection
Each panel depicts changes in variant frequencies over time. Variants are shown as circles on the oblong chromosomes, and advantageous variants are represented with a star. a | A classic selective sweep, in which a novel adaptive variant arises in a population and increases in frequency over time until it approaches fixation, leaving an excess of linkage disequilibrium with surrounding variants and a decrease in levels of genetic variation. b | Selection from standing variation, in which a variant that is already present in the population becomes advantageous in a new environment and increases in frequency over time until it approaches fixation. Because the variant exists on different haplotype backgrounds, it cannot be easily detected using tests of extended haplotype homozygosity. However, when this happens in a regionally restricted manner, there is a resultant excess of allele frequency differentiation in the population being subjected to adaptive pressures, relative to a population for which the variant does not confer a selective advantage. c | Selection on a complex trait involving multiple loci on different chromosomes (represented by oblongs in different colours); when this trait becomes advantageous, it increases in frequency as a set, leaving a more subtle signature of adaptation which may include subtle shifts in allele frequencies at multiple loci.
Figure 2
Figure 2. An abridged hypoxia-inducible factor 1 pathway
Distinct genes in the hypoxia-inducible factor 1 (HIF1) pathway are implicated in adaptation in different high-altitude populations (living at altitudes >2,500 metres above sea level) owing to convergent adaptation. Each gene interaction involving a candidate adaptive gene for high altitude is shown in relation to the HIF1 pathway. Genes that have been implicated as candidate adaptive genes in high-altitude Ethiopian populations,, high-altitude Tibetan populations,,,, and high-altitude Tibetan and Andean populations are indicated. HIF1α (also known as EPAS1) and HIF1β (also known as ARNT2) form a heterodimer known as the HIF1 transcription complex. Thyroid hormone receptor-β (THRB) is required for the expression of the HIF1 transcription complex, RAR-related orphan receptor A (RORA) induces transcription of HIF1α, egl nine homologue 1(EGLN1) is involved in the degradation of the HIF1 transcription complex, and the HIF1 transcription complex inhibits peroxisome proliferator-activated receptor-α (PPARA) expression.
Figure 3
Figure 3. Data integration approaches
A | An integrative genomics approach. Taking advantage of multiple types of data can direct us to functionally important regions of the genome, which could in turn narrow down the candidate regions at which selective pressures may have acted. Each circle represents a distinct type of data that can be overlaid to identify the subset of loci (shown in red) that contains candidate adaptive variants, functional variants and associations with the phenotypes of interest. B | Orr’s sign test of quantitative trait locus (QTL) effects. The x axis shows multiple loci, each with an effect on the trait of interest, which is shown on the y axis. In the neutral scenario, under the null hypothesis of neutrality, the expectation is that genetic drift will result in a situation in which positive and negative effects are randomly distributed among the loci involved in the trait. Under the alternative hypothesis of positive selection, however, the expectation is that the majority of loci involved in the trait will have either a positive or negative effect (part Ba). In the putatively adaptive scenario, the majority of loci have a positive effect on the trait of interest (shown in blue), consistent with adaptation (part Bb). C | The QST–FST test of neutrality. FST is a statistical measure of population structure or differences in variant frequencies between populations using genotypic data; QST is a statistical measure of population differentiation based on quantitative traits. The assumption is that when levels of QST exceed average levels of FST, the trait is exhibiting more inter-population divergence than expected under neutrality. The x axis includes genetic and multiple phenotypic traits, each with a measure of population structure that is displayed on the y axis, either by FST (measured with genotypic data) or QST (measured with phenotypic data). Traits 2 and 3 both have QST values that far exceed the average FST (shown by the asterisks), consistent with adaptation. eQTLs, expression quantitative trait loci.

References

    1. Scheinfeldt LB, Soi S, Tishkoff SA. Colloquium paper: working toward a synthesis of archaeological, linguistic, and genetic data for inferring African population history. Proc. Natl Acad. Sci. USA. 2010;107(Suppl. 2):8931–8938. - PMC - PubMed
    1. Henn BM, Cavalli-Sforza LL, Feldman MW. The great human expansion. Proc. Natl Acad. Sci. USA. 2012;109:17758–17764. - PMC - PubMed
    1. Jobling MA, Hurles M, Tyler-Smith C. Human Evolutionary Genetics: Origins, Peoples and Disease. Garland Publishing; 2004.
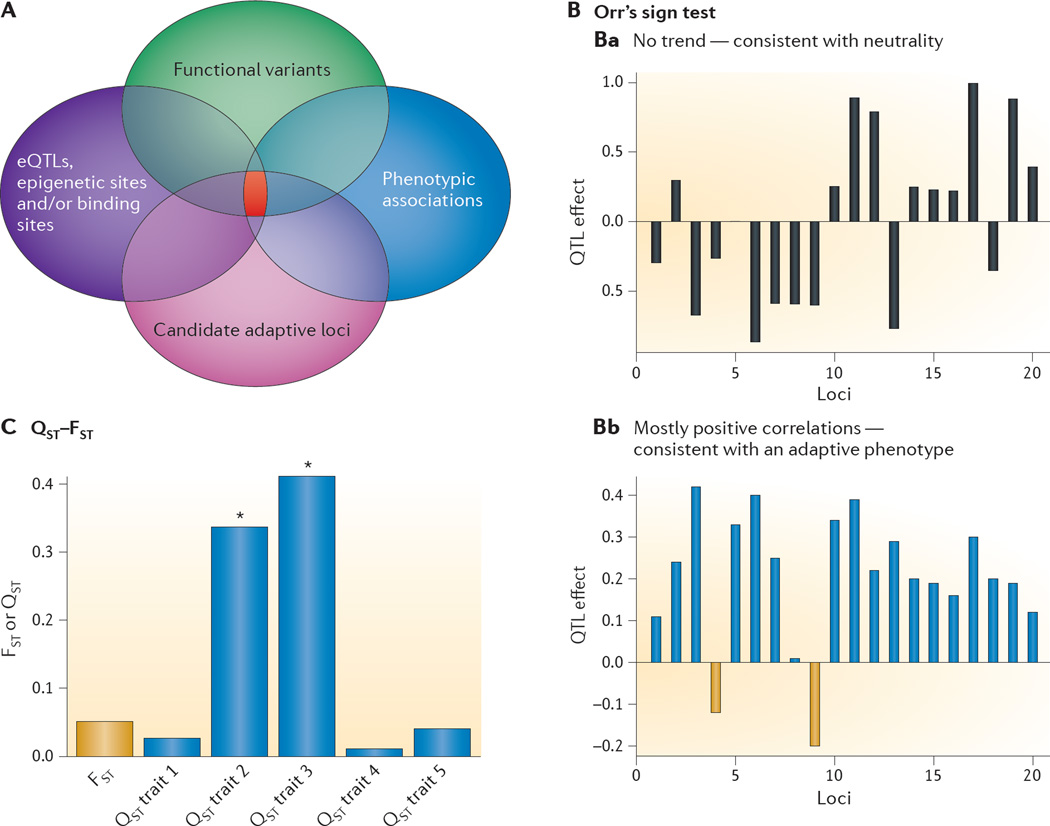
    1. Fraser HB. Gene expression drives local adaptation in humans. Genome Res. 2013;23:1089–1096. This study systematically evaluates the relative abundances of regulatory variation and coding variation in candidate adaptive regions and includes a novel method for identifying polygenic adaptation.

    1. Sabeti PC, et al. Detecting recent positive selection in the human genome from haplotype structure. Nature. 2002;419:832–837. - PubMed

Publication types