

Sensitivity of compressed spectral arrays for detecting seizures in acutely ill adults
- PMID: 24052456
- PMCID: PMC6794096
- DOI: 10.1007/s12028-013-9912-4
Sensitivity of compressed spectral arrays for detecting seizures in acutely ill adults
Abstract
Background: Continuous EEG recordings (cEEGs) are increasingly used in evaluation of acutely ill adults. Pre-screening using compressed data formats, such as compressed spectral array (CSA), may accelerate EEG review. We tested whether screening with CSA can enable detection of seizures and other relevant patterns.
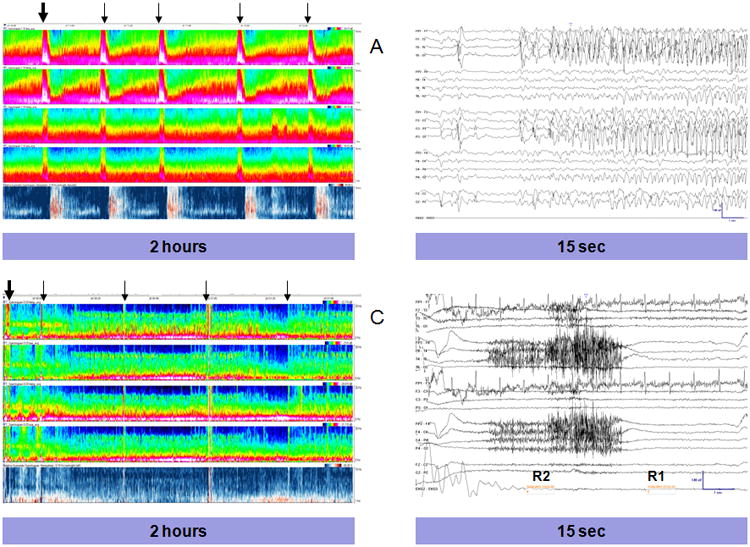
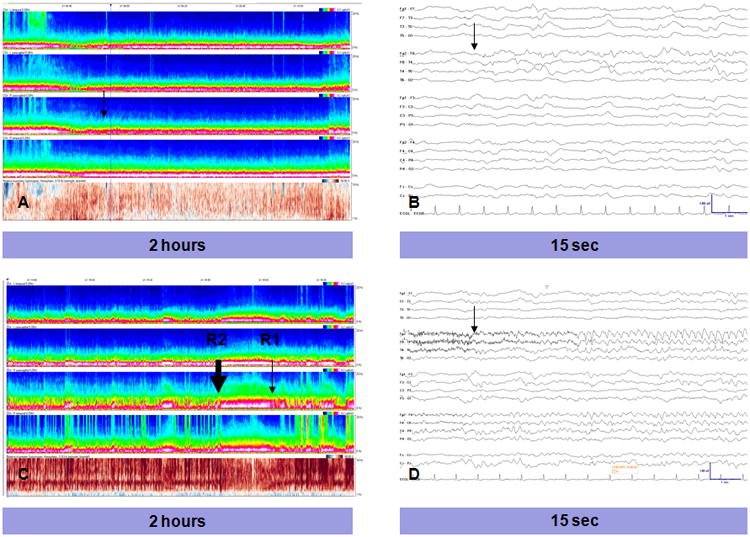
Methods: Two individuals reviewed the CSA displays of 113 cEEGs. While blinded to the raw EEG data, they marked each visually homogeneous CSA segment. An independent experienced electroencephalographer reviewed the raw EEG within 60 s on either side of each mark and recorded any seizures (and isolated epileptiform discharges, periodic epileptiform discharges (PEDs), rhythmic delta activity (RDA), and focal or generalized slowing). Seizures were considered to have been detected if the CSA mark was within 60 s of the seizure. The electroencephalographer then determined the total number of seizures (and other critical findings) for each record by exhaustive, page-by-page review of the entire raw EEG.
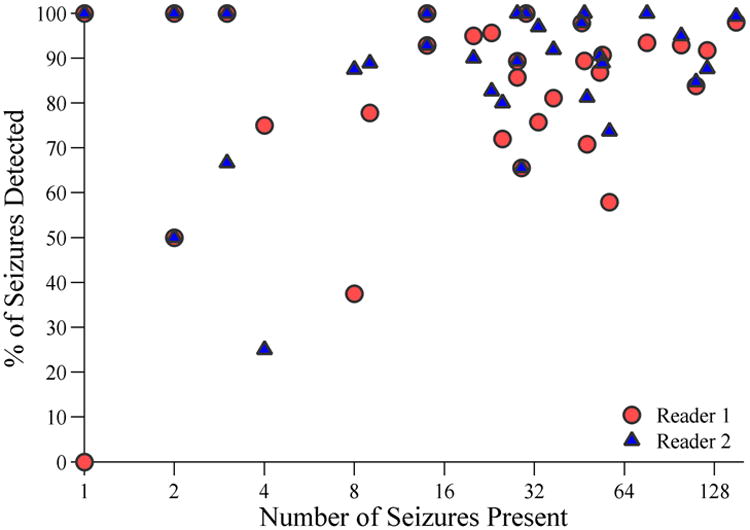
Results: Within each of the 39 cEEG recordings containing seizures, one CSA reviewer identified at least one seizure, while the second CSA reviewer identified 38/39 patients with seizures. The overall detection rate was 89.0 % of 1,190 total seizures. When present, an average of 87.9 % of seizures were detected per individual patient. Detection rates for other critical findings were as follows: epileptiform discharges, 94.0 %; PEDs, 100 %; RDA, 97.9 %; focal slowing, 100 %; and generalized slowing, 100 %.
Conclusions: CSA-guided review can support sensitive screening of critical pathological information in cEEG recordings. However, some patients with seizures may not be identified.
Conflict of interest statement
Drs. Williamson, Wahlster, Shafi and Westover declare that they have no conflicts of interest.
Figures
Similar articles
-
Spectrogram screening of adult EEGs is sensitive and efficient.Neurology. 2014 Jul 1;83(1):56-64. doi: 10.1212/WNL.0000000000000537. Epub 2014 May 23. Neurology. 2014. PMID: 24857926 Free PMC article.
-
Baseline EEG pattern on continuous ICU EEG monitoring and incidence of seizures.J Clin Neurophysiol. 2015 Apr;32(2):147-51. doi: 10.1097/WNP.0000000000000157. J Clin Neurophysiol. 2015. PMID: 25437330
-
Similarity of lateralized rhythmic delta activity to periodic lateralized epileptiform discharges in critically ill patients.JAMA Neurol. 2013 Oct;70(10):1288-95. doi: 10.1001/jamaneurol.2013.3475. JAMA Neurol. 2013. PMID: 23921464
-
Continuous EEG monitoring in the intensive care unit: an overview.J Clin Neurophysiol. 2004 Sep-Oct;21(5):332-40. J Clin Neurophysiol. 2004. PMID: 15592007 Review.
-
Detection of electrographic seizures with continuous EEG monitoring in critically ill patients.Neurology. 2004 May 25;62(10):1743-8. doi: 10.1212/01.wnl.0000125184.88797.62. Neurology. 2004. PMID: 15159471 Review.
Cited by
-
Early Diagnosis of Nonconvulsive Status Epilepticus Recurrence with Raw EEG of a Bispectral Index Monitor.Case Rep Crit Care. 2018 Sep 12;2018:1208401. doi: 10.1155/2018/1208401. eCollection 2018. Case Rep Crit Care. 2018. PMID: 30298108 Free PMC article.
-
Performance of Spectrogram-Based Seizure Identification of Adult EEGs by Critical Care Nurses and Neurophysiologists.J Clin Neurophysiol. 2017 Jul;34(4):359-364. doi: 10.1097/WNP.0000000000000368. J Clin Neurophysiol. 2017. PMID: 27930420 Free PMC article.
-
Sensitivity of quantitative EEG for seizure identification in the intensive care unit.Neurology. 2016 Aug 30;87(9):935-44. doi: 10.1212/WNL.0000000000003034. Epub 2016 Jul 27. Neurology. 2016. PMID: 27466474 Free PMC article.
-
Spectrogram screening of adult EEGs is sensitive and efficient.Neurology. 2014 Jul 1;83(1):56-64. doi: 10.1212/WNL.0000000000000537. Epub 2014 May 23. Neurology. 2014. PMID: 24857926 Free PMC article.
-
Inter-rater agreement on identification of electrographic seizures and periodic discharges in ICU EEG recordings.Clin Neurophysiol. 2015 Sep;126(9):1661-9. doi: 10.1016/j.clinph.2014.11.008. Epub 2014 Nov 20. Clin Neurophysiol. 2015. PMID: 25481336 Free PMC article. Clinical Trial.
References
-
- Jordan KG. Continuous EEG and evoked potential monitoring in the neuroscience intensive care unit. J Clin Neurophysiol. 1993;10:445–75. - PubMed
-
- Towne AR, Waterhouse EJ, Boggs JG, et al. Prevalence of nonconvulsive status epilepticus in comatose patients. Neurology. 2000;54:340–340. - PubMed
-
- Pandian J, Cascino G, Elson L, Manno E, Fulgham JR. Digital video-electroencephalographic monitoring in the neurological-neurosurgical intensive care unit. Arch Neurol. 2004;61:1090–1094. - PubMed
-
- Oddo M, Carrera E, Claassen J, Mayer SA, Hirsch LJ. Continuous electroencephalography in the medical intensive care unit. Crit Care Med. 2009;37:2051–2056. - PubMed
-
- Jette N, Claassen J, Emerson RG, Hirsch LJ. Frequency and predictors of nonconvulsive seizures during continuous electroencephalographic monitoring in critically ill children. Arch Neurol. 2006;63:1750–1755. - PubMed
Publication types
MeSH terms
Grants and funding
LinkOut - more resources
Full Text Sources
Other Literature Sources
Medical
