. 2014 Jan;95(1):19-31.
doi: 10.1189/jlb.0613311. Epub 2013 Sep 19.

CSF-1 receptor-mediated differentiation of a new type of monocytic cell with B cell-stimulating activity: its selective dependence on IL-34

Affiliations

CSF-1 receptor-mediated differentiation of a new type of monocytic cell with B cell-stimulating activity: its selective dependence on IL-34

Fumihiro Yamane et al. J Leukoc Biol. 2014 Jan.

Abstract

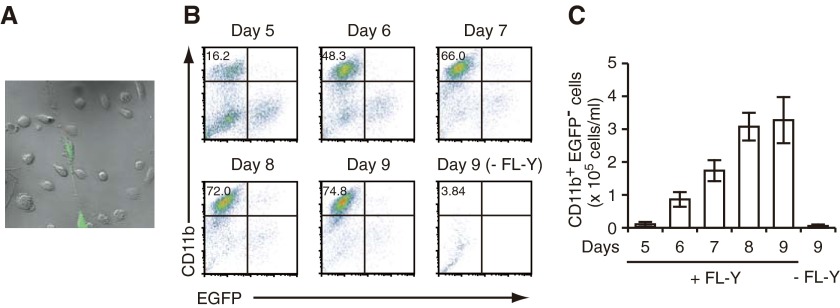
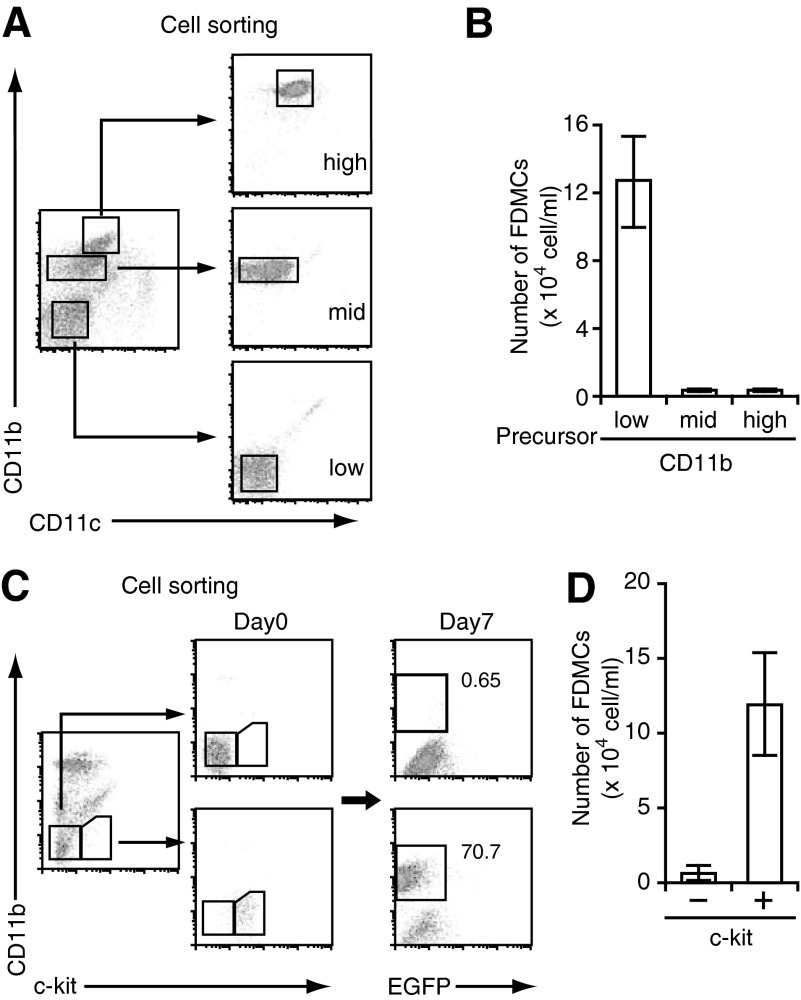
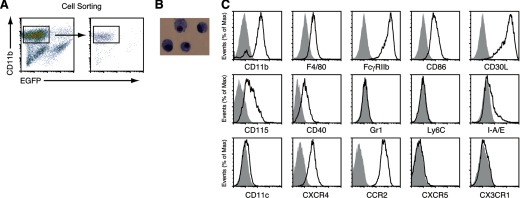
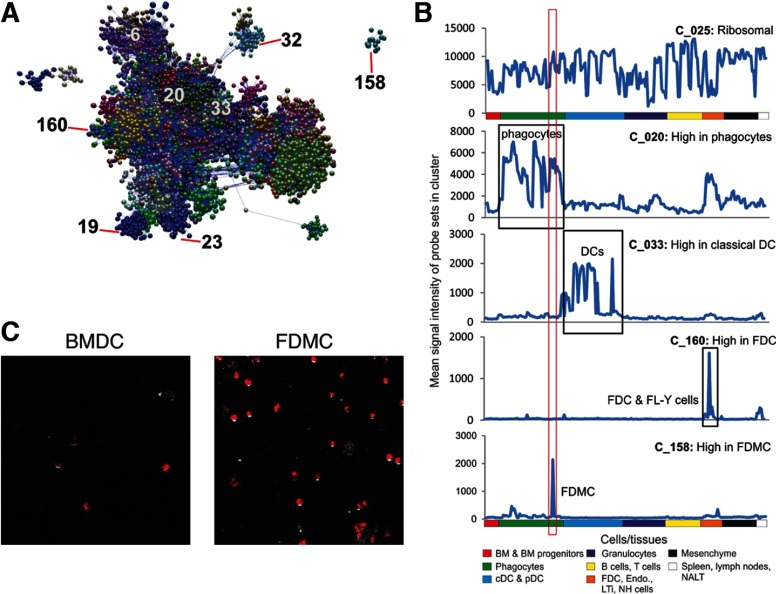
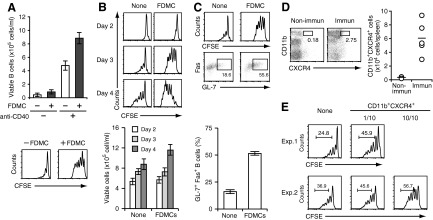
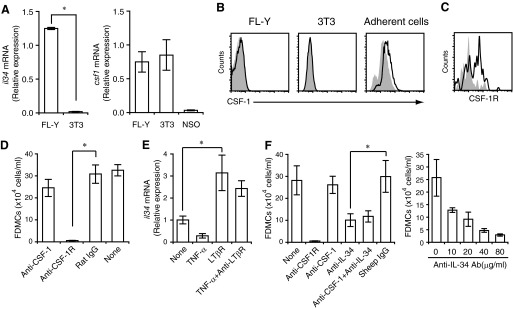
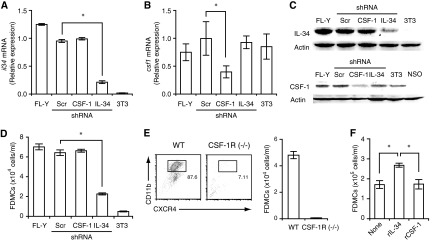
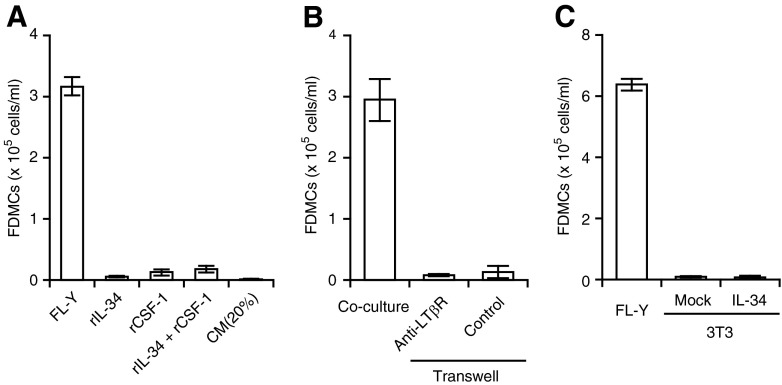
With the use of a mouse FDC line, FL-Y, we have been analyzing roles for FDCs in controlling B cell fate in GCs. Beside these regulatory functions, we fortuitously found that FL-Y cells induced a new type of CD11b⁺ monocytic cells (F4/80⁺, Gr-1⁻, Ly6C⁻, I-A/E(-/lo), CD11c⁻, CD115⁺, CXCR4⁺, CCR2⁺, CX₃CR1⁻) when cultured with a Lin⁻c-kit⁺ population from mouse spleen cells. The developed CD11b⁺ cells shared a similar gene-expression profile to mononuclear phagocytes and were designated as FDMCs. Here, we describe characteristic immunological functions and the induction mechanism of FDMCs. Proliferation of anti-CD40 antibody-stimulated B cells was markedly accelerated in the presence of FDMCs. In addition, the FDMC-activated B cells efficiently acquired GC B cell-associated markers (Fas and GL-7). We observed an increase of FDMC-like cells in mice after immunization. On the other hand, FL-Y cells were found to produce CSF-1 as well as IL-34, both of which are known to induce development of macrophages and monocytes by binding to the common receptor, CSF-1R, expressed on the progenitors. However, we show that FL-Y-derived IL-34, but not CSF-1, was selectively responsible for FDMC generation using neutralizing antibodies and RNAi. We also confirmed that FDMC generation was strictly dependent on CSF-1R. To our knowledge, a CSF-1R-mediated differentiation process that is intrinsically specific for IL-34 has not been reported. Our results provide new insights into understanding the diversity of IL-34 and CSF-1 signaling pathways through CSF-1R.

Keywords: CD11b; follicular dendritic cells; mouse spleen.


Figures

Figure 1.
Figure 1.. Development of FDMCs in the coculture of mouse spleen cells with FL-Y cells.
TBA-SCs (2×10⁵) from BALB/c mice were cultured with 2 × 10³ EGFP-expressing FL-Y cells in 1 ml of the culture medium for 5∼9 days. The cultured cells were observed with a confocal laser-scanning microscope and analyzed by flow cytometry after staining CD11b. (A) Microscopic observation of expanded cells in the coculture of TBA-SCs with EGFP+ FL-Y cells (culture for 9 days). (B) Flow cytometric analysis of FDMC induction on each day during coculture of TBA-SCs with EGFP+ FL-Y cells. FDMCs were assessed as CD11b+EGFP cells. The percentage of CD11b+EGFP cells was indicated at the upper left in each panel. Note that CD11b+EGFP cells were not induced in the absence of FL-Y cells (−FL-Y; lower right). (C) Time-course of the generation of FDMCs. The number of generated FDMCs in each culture was calculated from the percentage of CD11b+EGFP cells in the total number of viable cells, as observed in B. Data are presented as the mean ± sem from triplicate cultures. Representative data from three repeated experiments.
Figure 2.
Figure 2.. FDMCs were generated from c-kit+CD11b cells in spleen.
(A) B220CD3CD11c-gated spleen cells were sorted into CD11bhigh, Cd11bmid, and CD11blow populations by flow cytometry. (B) The same number of cells (2×10⁵) from each sorted fraction was cultured with 2 × 10³ EGFP+ FL-Y cells. Generation of FDMCs was assessed as indicated in Fig. 1B and C after culture for 9 days. (C) The CD11b fraction in TBA-SCs was sorted into c-kit+ and c-kit subsets. Cells from each subset (2×10⁴) were cultured with EGFP+ FL-Y cells (2×10³) for 7 days, followed by analysis of FDMC generation as in B. (D) The number of FDMCs generated from the culture of c-kit or c-kit+ cells with EGFP+ FL-Y cells (experiments shown in C). Data are presented as the mean ± sem of triplicate cultures. Representative data from three repeated experiments.
Figure 3.
Figure 3.. Flow cytometric analysis of surface markers on FDMCs.
(A) FDMCs were generated in the coculture of TBA-SCs with EGFP+ FL-Y cells for 9 days and purified by sorting as CD11b+EGFP cells. (B) May-Grünwald-Giemsa staining of FDMCs. (C) Flow cytometric analysis of FDMCs after staining with each antibody to indicated surface markers. Negative controls that were stained with each isotype-matched control antibody are shown in gray.
Figure 4.
Figure 4.. FDMCs shared a similar phenotype to mononuclear phagocytes.
(A) Network analysis of the 205 mouse cell and tissue gene-expression data sets using the tool BioLayout Express3D. This analysis enables the visualization of genes within a cluster across the entire data set. Genes with similar expression profiles are clustered together within the same region of the graph. Nodes represent transcripts (probe sets), edges represent correlations between individual expression profiles above r > 0.80, and the color of the nodes represent the cluster to which they have been assigned. The positions of representative clusters are annotated. (B) FDMCs share macrophage characteristics but not those of DCs. Five representative clusters derived from the network graph are shown and their mean probe set expression profiles across all data sets. The boxed area surrounded by a red line indicates the location of the FDMC data set; the black boxed areas show the location of the macrophage, classical DC (cDC), and FDC data sets. Cluster 25 is enriched in ribosomal genes that are expressed highly by almost all cell populations. Cluster 20 contains genes that are highly expressed by all of the phagocyte/macrophage populations. Cluster 158 represents genes specifically expressed in FDMCs. Genes in Cluster 33 were expressed specifically by classical DCs, whereas Cluster 160 was expressed highly by FDC (including FL-Y cells). pDC, plasmacytoid DC; Endo., endothelium; LTi, lymphoid tissue-inducer cells; NH, natural helper; NALT, nasal-associated lymphoid tissue. (C) Phagocytic activity of FDMCs compared with that of BMDCs. To compare phagocytic activity between FDMCs and BMDCs, these two types of cells were incubated with fluorescence-labeled E. coli particles for 2 h, as indicated in Materials and Methods.
Figure 5.
Figure 5.. Characterization of immunological functions of FDMCs in vitro and in vivo.
(A) Enhancement of proliferation of anti-CD40-stimulated B cells by the coculture with FDMCs. CFSE-labeled B cells (1×10⁶/ml) were cultured with or without 0.5 μg/ml anti-CD40 mAb for 4 days in the presence or absence of FDMCs (1×10⁵/ml) in 1 ml of the culture medium. The number of viable B cells after culture was calculated from the percentage of B220+ cells in the total number of viable cells (upper), and fluorescence intensities of cultured, CFSE-labeled B cells were measured by flow cytometry (lower). (B) Time-dependent enhancement of B cell proliferation by FDMCs. As indicated in A, CFSE-labeled B cells were stimulated with the anti-CD40 mAb in the presence or absence of FDMCs for 2, 3, or 4 days. Flow cytometric analysis of CFSE fluorescence intensity in cultured B cells (upper) and enumeration of viable B cells after culture for indicated days (lower) were performed as indicated in A. (C) Enhancement of GC B cell-associated marker expression in B cells that were cultured in the presence of FDMCs. CFSE-labeled B cells were cultured with or without FDMCs for 3 days as in A. CFSE fluorescence intensity and percentage of GL-7+Fas+ cells in B220-gated cells were estimated by flow cytometry (upper). Data from flow cytometric analyses were presented as histograms (lower). Data are presented as the mean ± sem from triplicate cultures. Representative data from two or three repeated experiments. (D) Increase of FDMC-like cells in immunized mice. A group of BALB/c mice (n=5) was immunized with TNP-KLH. Another group of mice was left nonimmunized as negative controls. On Day 12 after immunization, the frequency of FDMC-like cells was estimated by detecting CD11b+CXCR4+ cells in the CD3B220I-Ad−CD11c-gated population in the spleen cells from each mouse. Representative flow cytometry diagrams from immunized (Immun) and nonimmunized (Non-immun) mice are shown (left). (E) Enhancement of B cell proliferation by FDMC-like cells isolated from immunized mice. CD3B220I-Ad−CD11cCD11b+CXCR4+ FDMC-like cells were sorted from the pooled spleen cells of immunized mice. CFSE-labeled B cells were cultured with the anti-CD40 mAb in the presence or absence of the sorted FDMC-like cells (CD11b+CXCR4+), as described in A. FDMC-like cells were added at one of 10 or 10/10 of the number of input B cells as indicated. Two representative results (Exp. 1 and Exp. 2) are shown.
Figure 6.
Figure 6.. Development of FDMCs specifically depends on IL-34 that is produced from FL-Y cells.
(A) Expression of csf1 and il-34 mRNA in FL-Y and NIH3T3 (3T3) cells. NSO, Mouse plasmacytoma cell. (B) Absence of the membrane-bound form of CSF-1 on FL-Y and 3T3 cells. FL-Y cells (left) and 3T3 cells (middle) were stained with anti-CSF-1 mAb (lines) or an isotype-matched control antibody (shaded histograms), respectively. As a positive control, an adherent cell population prepared from the spleens of BALB/c mice (right) was stained similarly. (C) CSF-1R expression on Linc-kit+ FDMC precursor cells. TBA-SCs prepared from nonimmunized BALB/c mice were stained with anti-Lin marker, anti-c-kit, and anti-CD115 (CSF-1R) antibodies. The Linc-kit+-gated population was analyzed for expression of CSF-1R. Shaded histogram represents the staining with an isotype-matched control antibody. (D) Inhibition of FDMC generation by blockade of CSF-1R but not that of CSF-1. FDMC induction cultures were carried out as described in Fig. 1 in the presence or absence of 20 μg/ml indicated neutralizing antibodies. Isotype-matched control antibody (rat IgG) was added as a negative control. (E) Expression of il-34 mRNA in FL-Y cells. Cells were unstimulated or stimulated with TNF-α and/or an anti-LTβR mAb, as indicated for 48 h. The level of the il-34 mRNA was determined by qRT-PCR. Data were normalized to β-actin mRNA and presented as values relative to that in unstimulated FL-Y. (F) Inhibition of FDMC generation by a neutralizing anti-IL-34 antibody. Each indicated neutralizing antibody was added at 20 μg/ml to the FDMC induction culture (left). (Right) Varying concentrations of the anti-IL-34 antibody were added to the culture. Sheep IgG was added as an isotype-matched negative control. Data were presented as the mean ± sem from triplicate cultures. *Statistically significant difference (P<0.05). Representative data from three repeated experiments.
Figure 7.
Figure 7.. Further confirmation of dependence of FDMC generation on IL-34 and CSF-1R.
(A) Generation of the IL-34-KD strain of FL-Y. FL-Y cells were stably transfected with an IL-34-specific shRNA expression vector. As negative controls, FL-Y cells were transduced with a mock (Scr) vector or a CSF-1-specific shRNA expression vector. The il-34 mRNA level in each strain was assessed by qRT-PCR. NIH3T3 cells were used as an IL-34-negative control. Data were normalized to the level of β-actin mRNA. (B) The csf1 mRNA expression was reduced in the CSF-1-KD strain but not in the IL-34-KD strain. Data were normalized to the level of β-actin mRNA. (C) The IL-34-KD and the CSF-1-KD in FL-Y cells specifically reduced the IL-34 protein (upper) and the CSF-1 protein (lower), respectively. Cell lysates were prepared from FL-Y, the CSF-1-KD or the IL-34-KD cells, and analyzed by Western blotting. β-Actin was detected as loading controls. 3T3 and NSO cells were negative controls for expression of IL-34 and CSF-1, respectively. Only one major band is shown for the CSF-1 Western blot. (D) FDMC-inducing activity was abrogated in the IL-34-KD strain but not in the CSF-1-KD strain. Note that NIH3T3 cells that expressed CSF-1 but not IL-34 (as shown in A–C) did not induce FDMCs. (E) Inability of precursor cells from CSF-1R-deficient [CSF-1R (−/−)] mice to differentiate into FDMCs. The WT or CSF-1R-deficient precursor cells were cultured with FL-Y cells. Generation of FDMCs (CD11b+CXCR4+) was assessed by flow cytometry. (F) Improvement of the viability of FDMCs by IL-34 but not CSF-1. Purified FDMCs (5×10⁵ cells/ml) were cultured for 2 days in the presence of rIL-34 (10 ng/ml) or rCSF-1 (10 ng/ml) and examined for the number of viable cells on Day 2. Data were presented as the mean ± sem from triplicate cultures. *Statistically significant difference (P<0.05). Representative data from two or three repeated experiments.
Figure 8.
Figure 8.. In addition to IL-34, a contact-dependent signal delivered by FL-Y cells is required for FDMC generation.
(A) IL-34 alone was not sufficient for FDMC induction. TBA-SCs were cultured with FL-Y cells, rIL-34 (10 ng/ml), and/or rCSF-1 (10 ng/ml) for 9 days as described in Fig. 1. Where indicated, the CM of FL-Y cells was added at 20% (vol/vol). (B) Requirement of direct contact between FL-Y cells with the precursor cells for FDMC generation. In the transwell culture, 5 × 10³ FL-Y cells were added to the lower chamber, and TBA-SCs (2×10⁵ cells) were added to the upper chamber with a 0.45-μm pore-size membrane. Where indicated, an agonistic anti-LTβR mAb or a control antibody (each at 2.5 μg/ml) was added to the lower chamber to activate FL-Y cells. In a positive control experiment, FL-Y cells were cocultured with the precursor cells. (C) Failure of IL-34-expressing NIH3T3 cells to induce FDMCs. NIH3T3 cells were stably transduced with the empty vector (Mock) or the mouse IL-34 expression vector (IL-34). For induction of FDMCs, TBA-SCs were cultured with FL-Y or the engineered NIH3T3 cells. In all experiments, FDMC induction was assessed on Day 9 of the culture, as described in Fig. 1. Error bars indicate the mean ± sem from triplicate cultures.

Comment in

Similar articles

Cited by

References

    1. Vinuesa C. G., Sanz I., Cook M. C. (2009) Dysregulation of germinal centres in autoimmune disease. Nat. Rev. Immunol. 9, 845–857 - PubMed
    1. Rajewsky K. (1996) Clonal selection and learning in the antibody system. Nature 381, 751–758 - PubMed
    1. Liu M., Schatz D. G. (2009) Balancing AID and DNA repair during somatic hypermutation. Trends Immunol. 30, 173–181 - PubMed
    1. Allen C. D., Cyster J. G. (2008) Follicular dendritic cell networks of primary follicles and germinal centers: phenotype and function. Semin. Immunol. 20, 14–25 - PMC - PubMed
    1. Kosco-Vilbois M. H. (2003) Are follicular dendritic cells really good for nothing? Nat. Rev. Immunol. 3, 764–769 - PubMed

Publication types

MeSH terms

Substances