. 2013 Dec;24(12):2081-95.
doi: 10.1681/ASN.2013020173. Epub 2013 Sep 19.

Urine podocyte mRNAs, proteinuria, and progression in human glomerular diseases

Affiliations

Urine podocyte mRNAs, proteinuria, and progression in human glomerular diseases

Larysa Wickman et al. J Am Soc Nephrol. 2013 Dec.

Abstract

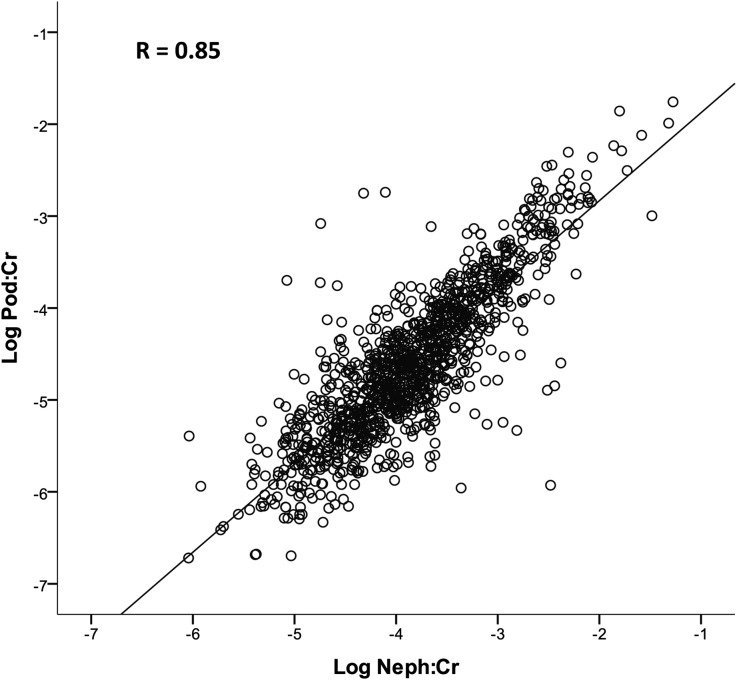
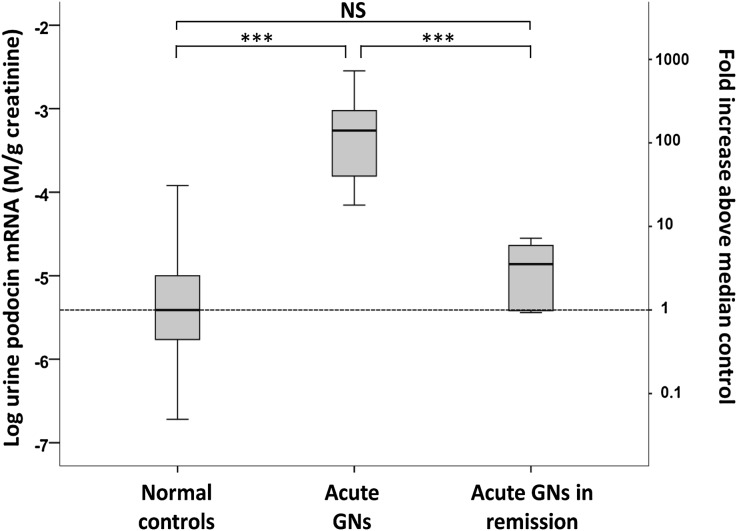
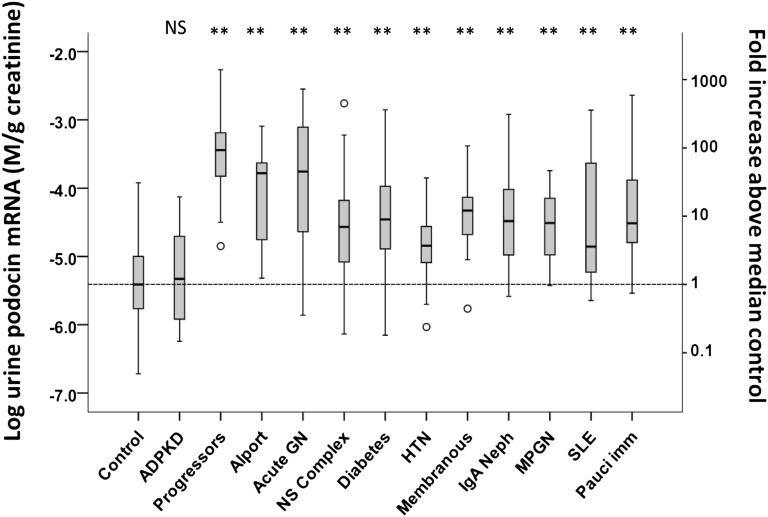
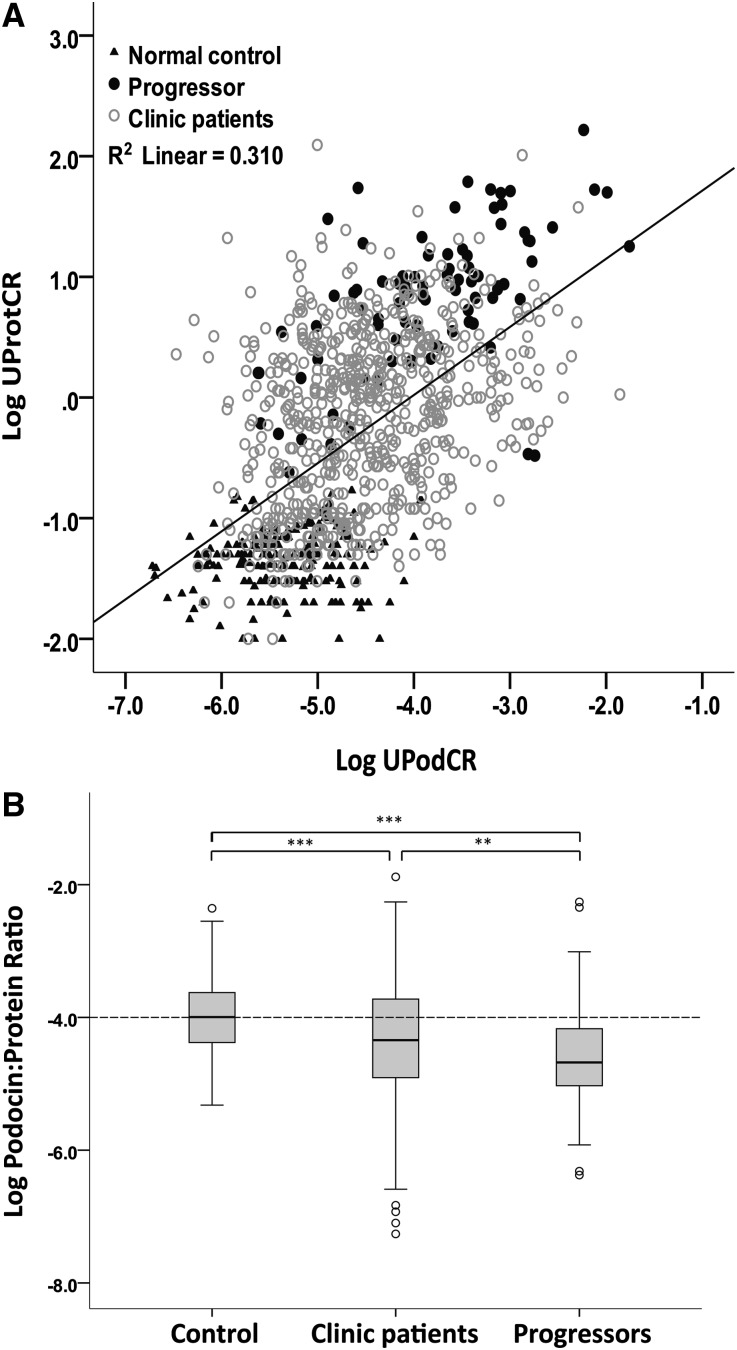
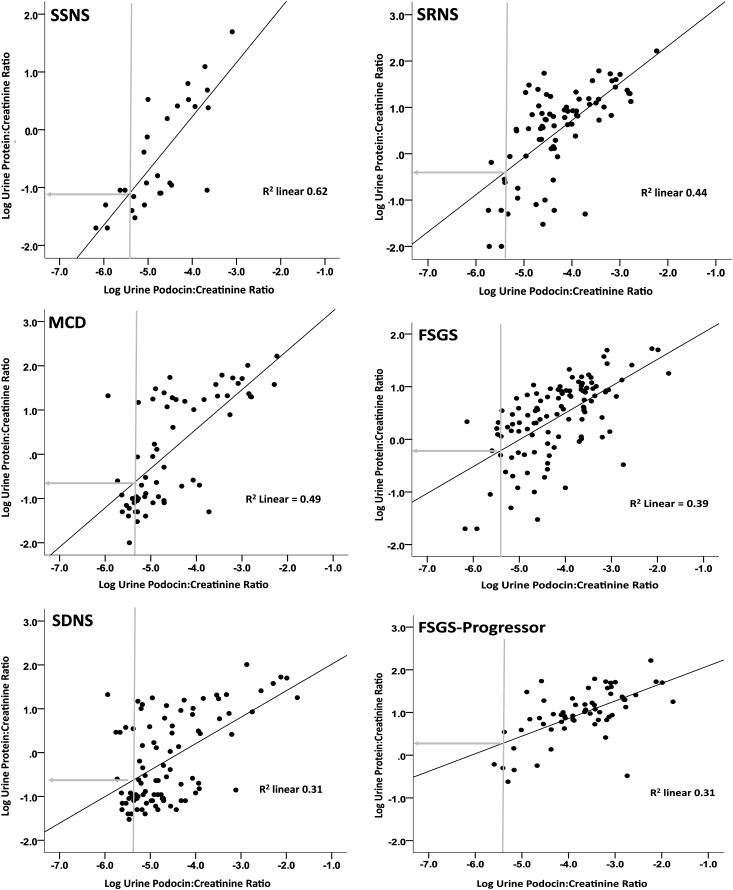
Model systems demonstrate that progression to ESRD is driven by progressive podocyte depletion (the podocyte depletion hypothesis) and can be noninvasively monitored through measurement of urine pellet podocyte mRNAs. To test these concepts in humans, we analyzed urine pellet mRNAs from 358 adult and pediatric kidney clinic patients and 291 controls (n=1143 samples). Compared with controls, urine podocyte mRNAs increased 79-fold (P<0.001) in patients with biopsy-proven glomerular disease and a 50% decrease in kidney function or progression to ESRD. An independent cohort of patients with Alport syndrome had a 23-fold increase in urinary podocyte mRNAs (P<0.001 compared with controls). Urinary podocyte mRNAs increased during active disease but returned to baseline on disease remission. Furthermore, urine podocyte mRNAs increased in all categories of glomerular disease evaluated, but levels ranged from high to normal, consistent with individual patient variability in the risk for progression. In contrast, urine podocyte mRNAs did not increase in polycystic kidney disease. The association between proteinuria and podocyturia varied markedly by glomerular disease type: a high correlation in minimal-change disease and a low correlation in membranous nephropathy. These data support the podocyte depletion hypothesis as the mechanism driving progression in all human glomerular diseases, suggest that urine pellet podocyte mRNAs could be useful for monitoring risk for progression and response to treatment, and provide novel insights into glomerular disease pathophysiology.


Figures

Figure 1.
Figure 1.
Two podocyte-specific mRNAs (podocin and nephrin) in urine samples correlate closely over 6 logs.
Figure 2.
Figure 2.
UPodCR reflects active glomerular diseases. At presentation of acute GN, defined as postinfectious GN or HSP, the UPodCR was on average 106-fold higher than in controls (P<0.001). In remission, 6–12 months after presentation and after return of the urine UProtCR to within the normal range, the UPodCR had returned to normal levels. These data show that the UPodCR reflects active disease at the time the urine sample is collected. The box represents median and interquartile ranges, and error bars present 1.5-fold x the interquartile range below 25th and above 75th percentile. Means were compared using ANOVA with post hoc Bonferroni correction for multiple comparisons. ***P<0.001. NS, not significant.
Figure 3.
Figure 3.
All progressor groups have persistently high UPodCR levels. The normal range derived from single samples of urine from individuals without kidney disease at left was compared with the average UPodCR values for each patient, demonstrating that the urine samples from kidney clinic patients in general had on average an 8-fold higher level of UPodCR than controls (P<0.001). The eGFR progressor group (n=8), GN progressor group (n=5) and FSGS progressor group (n=9) had 100-, 31-, and 92-fold higher average levels of UpodCR, respectively, compared with the normal control median (P<0.001). Each progressor group also had higher levels than the average clinic UPodCR value for nonprogressor patients (P<0.001). The range for the clinic patients was large, including individuals with normal levels and very high levels. The three progressor groups were not statistically different and so were combined as a single all-progressor group with an average that was 79-fold higher than normal (P<0.001). The box represents median and interquartile ranges, and error bars present 1.5-fold x the interquartile range below 25th and above 75th percentile. Means were compared using ANOVA with post hoc Bonferroni correction for multiple comparisons. ***P<0.001.
Figure 4.
Figure 4.
All glomerular disease groups have increased UPodCR compared to control and ADPKD. The average UPodCR value for all clinic urine samples collected for the combined-progressor group was 79-fold higher than for healthy controls. In all other glomerular groups evaluated, the UPodCR was highly significantly increased above the normal median (P<0.001). This includes Alport syndrome complex (chronic hereditary nephritis), Acute GNs (postinfectious GN and HSP), the nephrotic syndrome complex (MCD, SSNS, SDNS, SRNS, and FSGS), diabetes-associated glomerular disease, hypertension-associated glomerular disease, idiopathic membranous nephropathy, IgA nephropathy, MPGN, SLE-related glomerular diseases, and pauci-immune vasculitides. The only renal disease in which the UPodCR was not elevated was PKD, a nonglomerular progressive disease. In each disease group there were individual patients with high UPodCR levels predicted to be at increased risk for progression and those with levels in the normal range who would be predicted to be at lower risk for progression. The box represents median and interquartile ranges, and error bars present 1.5-fold x the interquartile range below 25th and above 75th percentile. Means were compared using ANOVA with post hoc Bonferroni correction for multiple comparisons. **P<0.001. NS, not significant.
Figure 5.
Figure 5.
All nephrotic syndrome complex groups have high UPodCR in association with higher level proteinuria. The FSGS progressor group (n=9) had on average a 92-fold higher median level of UPodCR compared with the normal median (P<0.001). Patients with a biopsy diagnosis of MCD or FSGS (who did not meet criteria for progression) had on average a 10- and 13-fold higher median UpodCR, respectively (P<0.001 compared with normal control), although the range varied up to >100-fold above normal, well within the FSGS progressor group range. The clinical descriptors SRNS, SDNS, and SSNS had similar median UPodCR values that were 16-, 14- and 16-fold above the control median, respectively. There were no significant differences in UPodCR values between FSGS, MCD, SDNS, SRNS, or SSNS groups with or without proteinuria. The patients with nephrotic syndrome complex as a whole who had been brought into remission by various treatments, resulting in reduction of proteinuria into the normal range (UProtCR ≤0.18), had significantly reduced UPodCR values toward the normal range (not significantly different from control). The box represents median and interquartile ranges, and error bars present 1.5-fold x the interquartile range below 25th and above 75th percentile. Means were compared using k-way ANOVA with post hoc Bonferroni correction for multiple comparisons. **P<0.001. NS, not significant.
Figure 6.
Figure 6.
Proteinuria correlates with the rate of podocyte detachment (UPodCR)and is relatively increased in progressors. (A) Control samples (filled triangles), progressors (filled circles), and other clinic samples (open circles) are shown. See Table 4 for statistical data. Individual data points are shown (n=1143). The overall correlation R is 0.56 (P<0.001). Note that the progressors tend to lie above the regression line. (B) The same data presented as the urine podocin-to-protein ratio, confirming that progressors have a significantly lower ratio than do controls or other clinic patients. Therefore, although the rate of podocyte detachment is higher for progressors, they have an even higher rate of proteinuria than would be predicted from the UPodCR. The box represents median and interquartile ranges, and error bars present 1.5-fold x the interquartile range below 25th and above 75th percentile. Means were compared using ANOVA with post hoc Bonferroni correction for multiple comparisons. **P=0.003, ***P<0.001.
Figure 7.
Figure 7.
The correlation slope for UPodCR versus UProtCR is flatter for FSGS and FSGS progressors than for SSNS and MCD, which suggests that change in proteinuria is a less sensitive marker of progression in FSGS. Nephrotic syndrome subgroups are shown as defined in Table 1 as SSNS, SDNS, SRNS, MCD, FSGS, and FSGS progressor patients (see Concise Methods). Individual data points are shown. The calculated slope relating UPodCR to UProtCR is shown for each data set (see also Table 4). Note that the slope in SSNS and MCD is significantly steeper than for other subgroups. In contrast, the slope is significantly flatter for FSGS and flattest for FSGS progressors. The vertical gray line in each panel shows the median normal control UPodCR value. The horizontal gray line shows the predicted average level of proteinuria (UPodCR) corresponding to median control value for UPodCR derived from the slope line, where the Log −1 and Log 0 correspond to UProtCR values of 0.1 and 1, respectively. This change in slope reflects a changed relationship between podocyte detachment rate and proteinuria, probably resulting from uncompensated podocyte detachment leaving a bare area of leaky glomerular basement membrane, as demonstrated in model systems., As a consequence of this altered slope, if a hypothetical treatment were to successfully reduce the rate of podocyte detachment to the control median value, significant proteinuria would persist in FSGS but not in SSNS/MCD. Proteinuria is therefore a very sensitive marker of the podocyte detachment rate in SSNS and MCD, but a less sensitive marker of the rate of podocyte detachment in FSGS and particularly in FSGS progressors.
Figure 8.
Figure 8.
Different glomerular diseases have different relationships between rate of podocyte detachment and proteinuiria, which suggests that proteinuria is a less sensitive marker of progression in some glomerular diseases (e.g., membranous nephropathy). Groups are shown as in Table 1. Acute GNs are combined postinfectious GN and HSP; SLE-associated glomerular diseases; diabetes-associated kidney disease; IgA nephropathy, pauci-immune GN, and membranous GN. Individual data points are shown. Table 4 provides details of slopes and slope comparisons. The vertical gray line denotes the normal median value for UPodCR. The horizontal gray line projects the UProtCR value corresponding to the median UPodCR value provided by the slope, where the Log −1 and Log 0 correspond to UProtCR values of 0.1 and 1, respectively. Note the significant differences between disease groups with respect to the slope relating UPodCR to UprotCR, with the relationship being significant in acute GNs, SLE, and diabetes, where the slope is not significantly different from FSGS, as shown in Figure 7 and Table 4. In contrast, UPodCR and UProtCR did not correlate for IgA nephropathy, pauci-immune GNs, or membranous nephropathy, and these conditions were significantly different from both the FSGS and the SSNS/MCD groups (Table 4). Note from the intercept of the gray line on the vertical axis that for membranous GN reducing the rate of podocyte detachment to the normal median level would be projected not to affect proteinuria significantly, as might be expected for membranous nephropathy. In contrast, reduction of the rate of podocyte detachment for diabetes, SLE, and acute GNs would be expected to reduce proteinuria.

References

    1. Wiggins RC: The spectrum of podocytopathies: A unifying view of glomerular diseases. Kidney Int 71: 1205–1214, 2007 - PubMed
    1. Kriz W, Gretz N, Lemley KV: Progression of glomerular diseases: Is the podocyte the culprit? Kidney Int 54: 687–697, 1998 - PubMed
    1. Kim YH, Goyal M, Kurnit D, Wharram B, Wiggins J, Holzman L, Kershaw D, Wiggins R: Podocyte depletion and glomerulosclerosis have a direct relationship in the PAN-treated rat. Kidney Int 60: 957–968, 2001 - PubMed
    1. Wharram BL, Goyal M, Wiggins JE, Sanden SK, Hussain S, Filipiak WE, Saunders TL, Dysko RC, Kohno K, Holzman LB, Wiggins RC: Podocyte depletion causes glomerulosclerosis: Diphtheria toxin-induced podocyte depletion in rats expressing human diphtheria toxin receptor transgene. J Am Soc Nephrol 16: 2941–2952, 2005 - PubMed
    1. Kriz W, LeHir M: Pathways to nephron loss starting from glomerular diseases-insights from animal models. Kidney Int 67: 404–419, 2005 - PubMed

Publication types

MeSH terms