. 2013 Jun 4;1(1):79-89.
doi: 10.1016/j.stemcr.2013.03.005. eCollection 2013.

Identification of novel imprinted differentially methylated regions by global analysis of human-parthenogenetic-induced pluripotent stem cells

Affiliations

Identification of novel imprinted differentially methylated regions by global analysis of human-parthenogenetic-induced pluripotent stem cells

Yonatan Stelzer et al. Stem Cell Reports. .

Abstract

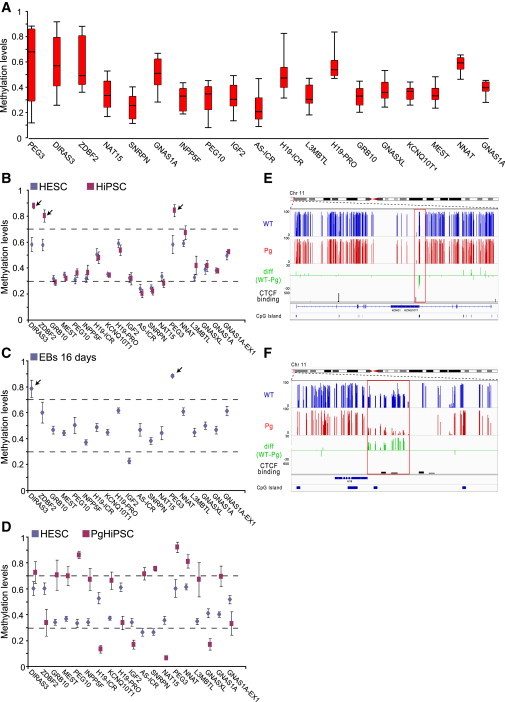
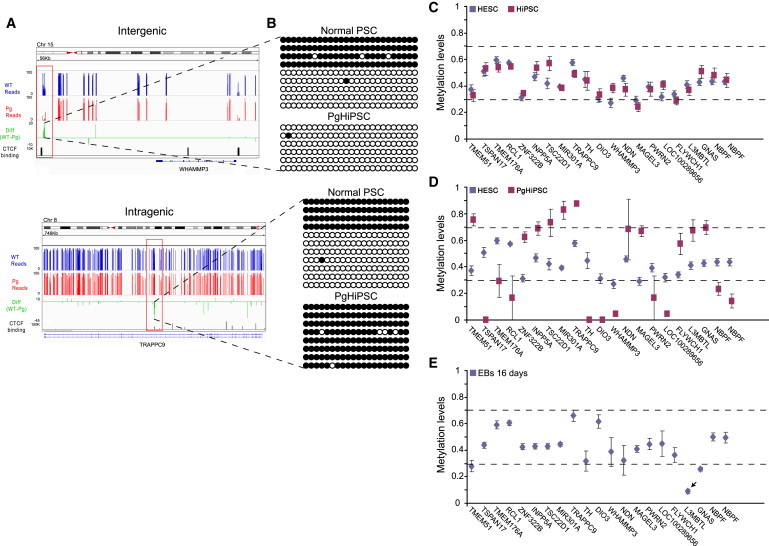
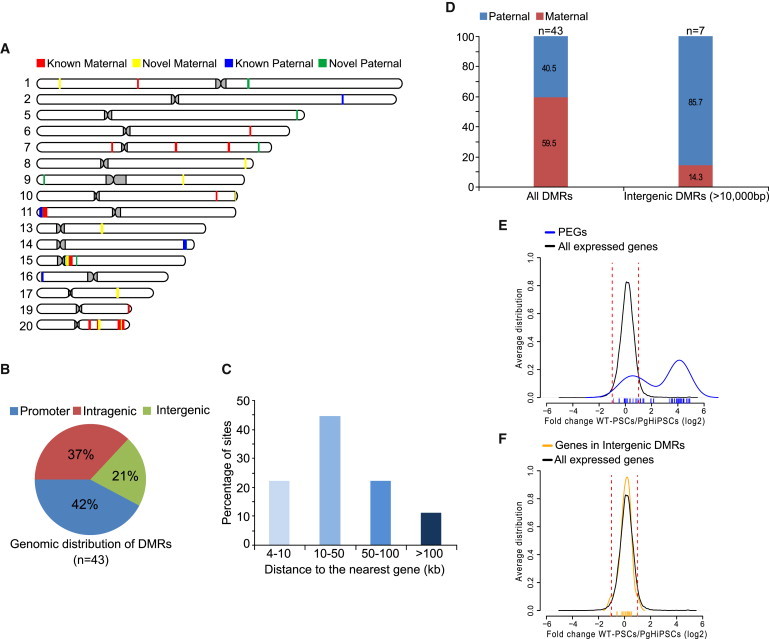
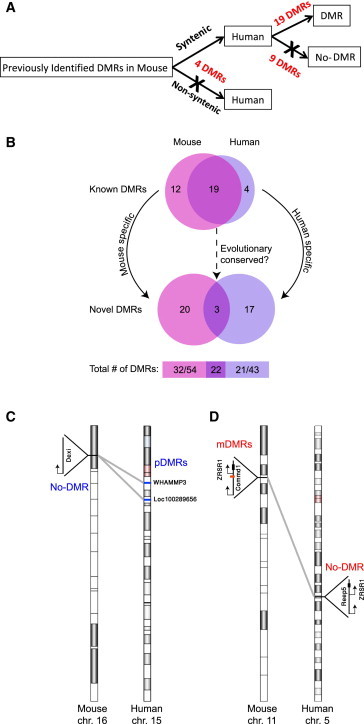
Parental imprinting is an epigenetic phenomenon by which genes are expressed in a monoallelic fashion, according to their parent of origin. DNA methylation is considered the hallmark mechanism regulating parental imprinting. To identify imprinted differentially methylated regions (DMRs), we compared the DNA methylation status between multiple normal and parthenogenetic human pluripotent stem cells (PSCs) by performing reduced representation bisulfite sequencing. Our analysis identified over 20 previously unknown imprinted DMRs in addition to the known DMRs. These include DMRs in loci associated with human disorders, and a class of intergenic DMRs that do not seem to be related to gene expression. Furthermore, the study showed some DMRs to be unstable, liable to differentiation or reprogramming. A comprehensive comparison between mouse and human DMRs identified almost half of the imprinted DMRs to be species specific. Taken together, our data map novel DMRs in the human genome, their evolutionary conservation, and relation to gene expression.


Figures

Figure 1
Figure 1
Genome-wide Analysis of Imprinted DMRs in PSCs (A) Box-plot analysis showing distribution of DNA methylation in 20 HESCs lines in known imprinted DMRs. DMRs are ordered according to the levels of heterogeneity (x axis). (B–D) Average methylation calls ± SE of different cell types in known imprinted DMRs. DMRs are ordered by chromosome numbers (x axis); small arrows pointing to DMRs that are perturbed in the different cell types. (E and F) Regional view of KCNQ1 and H19 known DMR. Average methylation values for wild-type PSCs (blue) and PgHiPSCs (red) of all CpG calls. Green track indicates the difference between hemimethylated (AMC between 0.3 and 0.7) wild-type PSCs and PgHiPSCs CpGs. Shown are significant putative CTCF binding sites in H1 ES cells from the ENCODE project (depicted in black rectangles, p value < 1 × 10−5) and CpG islands (UCSC) in dark-blue rectangles. See also Figures S1 and S2.
Figure 2
Figure 2
Genome-wide Analysis of Imprinted DMRs in PSCs (A) Regional view of two representative new DMR, TRAPPC9 and WHAMMP3. Average methylation values for wild-type HESCs (blue) and PgHiPSCs (red) of all CpG calls. Green track indicates the difference between hemimethylated (AMC between 0.3 and 0.7) wild-type PSCs and PgHiPSCs CpGs. Shown are significant putative CTCF binding sites in H1 ES cells from the ENCODE project (depicted in black rectangles, p value < 1 × 10−5) and CpG islands (UCSC) in dark-green rectangles. See also Figure S3. (B) Bisulfite sequencing validation of pDMR (WHAMMP3, upper panel) and mDMR (TRAPPC9, lower panel) was conducted on normal independent PSC not included in the original analysis and PgHiPSCs lines. (C–E) Methylation values (y axis) ± SE in various cell types across the different imprinted DMRs (x axis); small arrows pointing to DMRs that are perturbed in the different cell types. (C) Comparison between HESCs and HiPSCs demonstrate the striking similarities between the two cell types. (D) Comparison between HESCs and the PgHiPSCs showing the differences between the two cell types in methylation values, as the PgHiPSCs are either hypermethylated (AMC >0.7) or hypomethylated (AMC <0.3) in comparison to hemimethylation state (AMC between 0.3 and 0.7) of the biparental cells. (E) Analysis of methylation in 16-day-old EBs differentiated from HESCs, demonstrating that the newly identified imprinted DMRs are highly stable following in vitro differentiation. Notable exception is the DMR in the L3MBTL locus, which is consistently hypomethylated in the differentiated cells.
Figure 3
Figure 3
Characterization of Imprinted DMRs Identified in This Study (A) Chromosomal distribution of the 43 imprinted DMRs. (B) Pie chart representing the different genomic properties of all imprinted DMRs. (C) Distribution of distances of the imprinted intergenic DMRs to their nearest gene. (D) Percentage of maternal and paternal DMRs; all DMRs identified (left bar) and the subset of intergenic DMRs (right panel). (E and F) Distribution of expression ratios between normal PSCs and PgHiPSCs; x axes represent the log2 fold change between normal PSCs and PgHiPSCs, and y axes represent the distribution of frequencies for each of the samples; values for individual genes are represented by small vertical lines on the x axes; Verticals segmented red lines represent 2-fold in expression ratio. (E) Blue, genes associated with intragenic mDMRs (n = 64); black, all expressed genes (>30 reads, n = 13,223). See also Table S1. (F) Orange, genes associated with intergenic DMRs (>10 kb from the nearest gene, n = 23); black, all expressed genes. See also Figure S4 and Table S2.
Figure 4
Figure 4
Synteny Analysis between Mouse and Human Imprinted DMRs (A) DNA methylation analysis of previously identified mouse DMRs in human syntenic regions. See also Table S3. (B) Vann diagram demonstrating species-specific imprinted DMRs in known DMRs (upper panel), and in novel DMRs (lower panel) identified either by Xie et al. (2012) (left subset) or in our study (right subset). Bottom numbers represent the number of species-specific DMRs (left and right) and shared DMRs among species. See also Table S3. (C and D) (C) Synteny analysis of mouse-specific DMR in the Commd1/Zrsr1, and (D) the human-specific DMRs WHAMMP3 and LOC100289656 that resides in the Prader-Willi/Angelman region.

References

    1. Bartolomei M.S., Ferguson-Smith A.C. Mammalian genomic imprinting. Cold Spring Harb. Perspect. Biol. 2011;3 - PMC - PubMed
    1. Bell A.C., Felsenfeld G. Methylation of a CTCF-dependent boundary controls imprinted expression of the Igf2 gene. Nature. 2000;405:482–485. - PubMed
    1. Bell A.C., West A.G., Felsenfeld G. The protein CTCF is required for the enhancer blocking activity of vertebrate insulators. Cell. 1999;98:387–396. - PubMed
    1. Bock C., Tomazou E.M., Brinkman A.B., Müller F., Simmer F., Gu H., Jäger N., Gnirke A., Stunnenberg H.G., Meissner A. Quantitative comparison of genome-wide DNA methylation mapping technologies. Nat. Biotechnol. 2010;28:1106–1114. - PMC - PubMed
    1. Bock C., Kiskinis E., Verstappen G., Gu H., Boulting G., Smith Z.D., Ziller M., Croft G.F., Amoroso M.W., Oakley D.H. Reference Maps of human ES and iPS cell variation enable high-throughput characterization of pluripotent cell lines. Cell. 2011;144:439–452. - PMC - PubMed

Publication types