. 2013 Sep 20:14:632.
doi: 10.1186/1471-2164-14-632.

An expression atlas of human primary cells: inference of gene function from coexpression networks

Affiliations

An expression atlas of human primary cells: inference of gene function from coexpression networks

Neil A Mabbott et al. BMC Genomics. .

Abstract

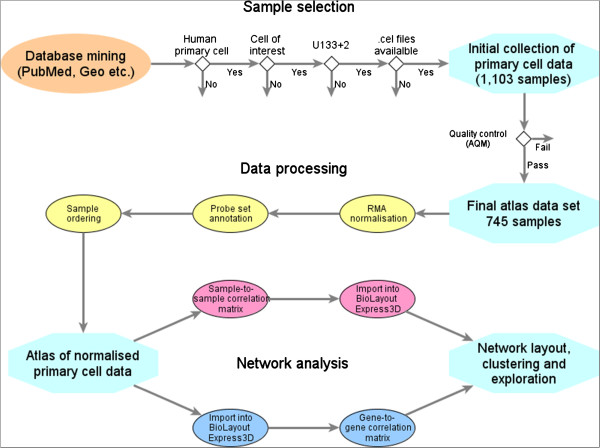
Background: The specialisation of mammalian cells in time and space requires genes associated with specific pathways and functions to be co-ordinately expressed. Here we have combined a large number of publically available microarray datasets derived from human primary cells and analysed large correlation graphs of these data.

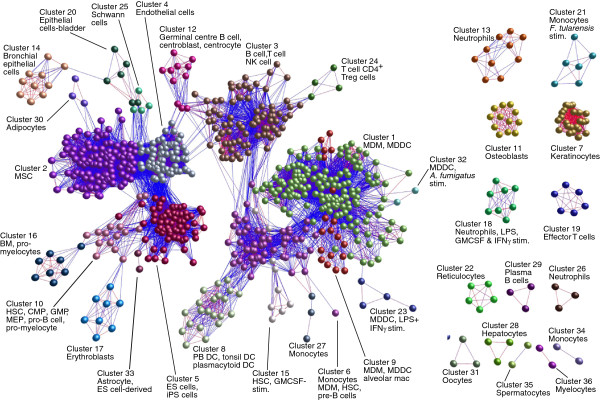
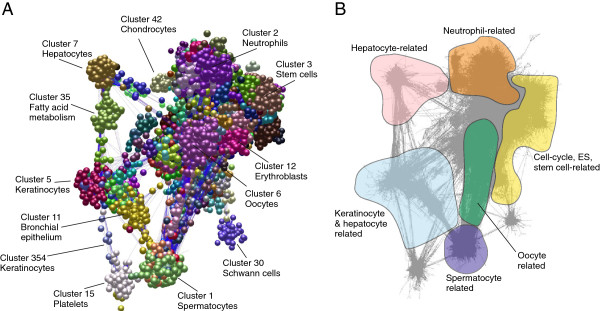
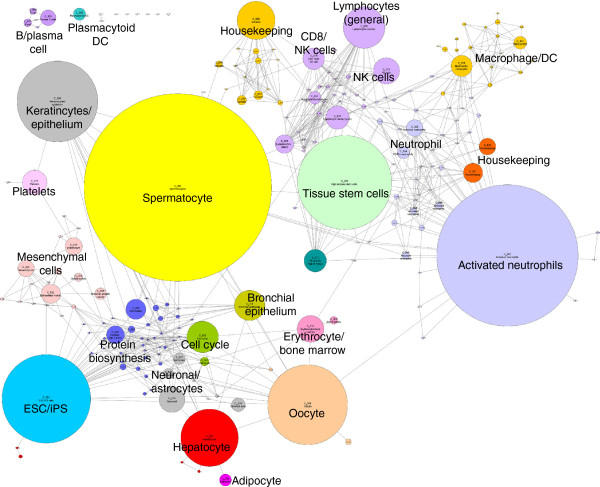
Results: Using the network analysis tool BioLayout Express3D we identify robust co-associations of genes expressed in a wide variety of cell lineages. We discuss the biological significance of a number of these associations, in particular the coexpression of key transcription factors with the genes that they are likely to control.

Conclusions: We consider the regulation of genes in human primary cells and specifically in the human mononuclear phagocyte system. Of particular note is the fact that these data do not support the identity of putative markers of antigen-presenting dendritic cells, nor classification of M1 and M2 activation states, a current subject of debate within immunological field. We have provided this data resource on the BioGPS web site (http://biogps.org/dataset/2429/primary-cell-atlas/) and on macrophages.com (http://www.macrophages.com/hu-cell-atlas).


Figures

Figure 1
Figure 1
Data analysis workflow. Data analysis pipeline, from the selection of microarray data, through to normalisation, annotation and network analysis.
Figure 2
Figure 2
Clustering of samples based upon their gene global expression profiles. A Pearson correlation matrix was prepared comparing the data derived from all samples used in this study. A graph was then constructed using only those sample-to-sample relationships where r ≥ 0.9. Nodes represent samples and edges are coloured on a sliding scale according to the strength of the correlation (red, r = 1.0; blue, r = 0.9). The graph was then clustered using an MCL inflation value of 2.2, each cluster of samples being assigned a different colour. It is quite striking that almost without exception related cell types cluster together or are positioned within similar network neighbourhoods irrespective of the source of the data. Full details of the sources of all data sets used in the analysis is provided in Additional file 1: Table S1. Additional abbreviations used: CMP, common myeloid progenitors; GMP, granulocyte monocyte progenitors; HSC, haematopoietic stem cell; mac., macrophage; MDDC, monocyte-derived DC; MDM, monocyte-derived macrophage; MEP, megakaryocyte–erythroid progenitor cell; MSC, mesenchymal stem cells; NK, natural killer; PB, peripheral blood; stim., stimulated; Treg, regulatory T cell.
Figure 3
Figure 3
Network analysis of human primary cell transcriptomics data. (A) Main component of the network graph derived from 745 samples of human primary cell populations run on Affymetrix U133plus2.0 arrays. Nodes represent transcripts (probesets), edges represent correlations between individual expression profiles above r ≥ 0.75 and the colour of the nodes represents the cluster to which they have been assigned. The graph comprises of 24,808 nodes connected by 1,476,632 edges. (B) An image of the network graph showing edges only. Areas of enrichment of genes expressed in particular cell lineages are indicated.
Figure 4
Figure 4
Collapsed cluster diagram showing the relationship between cluster size and position within the network graph. All the clusters derived from the network graph (Figure 3) with >10 nodes were “collapsed” such that each cluster is presented as a single node with size of the node proportional to the number of probe sets in the cluster. Edges represent instances where nodes in one cluster share correlations (r ≥ 0.75) with nodes in an adjacent cluster. Each cluster number is annotated with its number (C_00N) and clusters are coloured to reflect the underlying biological function or process which they are considered to represent.

References

    1. Ala U, Piro RM, Grassi E, Damasco C, Silengo L, Oti M, Provero P, Di Cunto F. Prediction of human disease genes by human-mouse conserved coexpression analysis. PLoS Comput Biol. 2008;4(3):e1000043. doi: 10.1371/journal.pcbi.1000043. - DOI - PMC - PubMed
    1. Hume DA, Summers KM, Raza S, Baillie JK, Freeman TC. Functional clustering and lineage markers: insights into cellular differentiation and gene function from large-scale microarray studies of purified primary cell populations. Genomics. 2010;95(6):328–338. doi: 10.1016/j.ygeno.2010.03.002. - DOI - PubMed
    1. Miozzi L, Piro RM, Rosa F, Ala U, Silengo L, Di Cunto F, Provero P. Functional annotation and identification of candidate disease genes by computational analysis of normal tissue gene expression data. PLoS One. 2008;3(6):e2439. doi: 10.1371/journal.pone.0002439. - DOI - PMC - PubMed
    1. Piro RM, Ala U, Molineris I, Grassi E, Bracco C, Perego GP, Provero P, Di Cunto F. An atlas of tissue-specific conserved coexpression for functional annotation and disease gene prediction. Eur J Hum Genet. 2011;19(11):1173–1180. doi: 10.1038/ejhg.2011.96. - DOI - PMC - PubMed
    1. Summers KM, Raza S, van Nimwegen E, Freeman TC, Hume DA. Co-expression of FBN1 with mesenchyme-specific genes in mouse cell lines: implications for phenotypic variability in Marfan syndrome. Eur J Hum Genet. 2010;18(11):1209–1215. doi: 10.1038/ejhg.2010.91. - DOI - PMC - PubMed

Publication types

Substances