. 2013 Oct 10;52(1):101-12.
doi: 10.1016/j.molcel.2013.08.027. Epub 2013 Sep 19.

The imprinted H19 lncRNA antagonizes let-7 microRNAs

Affiliations

The imprinted H19 lncRNA antagonizes let-7 microRNAs

Amanda N Kallen et al. Mol Cell. .

Abstract

Abundantly expressed in fetal tissues and adult muscle, the developmentally regulated H19 long noncoding RNA (lncRNA) has been implicated in human genetic disorders and cancer. However, how H19 acts to regulate gene function has remained enigmatic, despite the recent implication of its encoded miR-675 in limiting placental growth. We noted that vertebrate H19 harbors both canonical and noncanonical binding sites for the let-7 family of microRNAs, which plays important roles in development, cancer, and metabolism. Using H19 knockdown and overexpression, combined with in vivo crosslinking and genome-wide transcriptome analysis, we demonstrate that H19 modulates let-7 availability by acting as a molecular sponge. The physiological significance of this interaction is highlighted in cultures in which H19 depletion causes precocious muscle differentiation, a phenotype recapitulated by let-7 overexpression. Our results reveal an unexpected mode of action of H19 and identify this lncRNA as an important regulator of the major let-7 family of microRNAs.


Figures

Figure 1
Figure 1. Bioinformatics predicted let-7 binding sites at four distinct positions in human H19
(A) Partial sequences of H19 and sequences of four let-7 subtypes are shown. Nucleotides of the miRNA seed region (position 2 to 8) are in red. Numbers are in nucleotides relative to the transcriptional start site of H19. The deleted nucleotides in psiCHECK2-H19D are marked in blue. See also Figure S2A. (B) Profile of evolutionary conservation scores for human H19 lncRNA. The portions of the profile for four let-7 binding sites are in red, with average conservation score given on top.
Figure 2
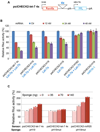
Figure 2. H19 contains functional let-7 interaction sites
(A) Reporter constructs. (B) The indicated constructs were each transfected into HEK293 cells, together with control miRNA (Ctr), let-7 or miR16-1 at a final concentration of 12, 24, or 48 nM. In Let-7a + Let-7b, equal concentrations of let-7a and let-7b were combined to give the indicated final concentrations. Numbers are mean ± SD (n=3). See also Figure S1. (C) Let-7 sensor (psiCHECK2-let-7 4×) or miR20 sensor (psiCHECK2-miR20) were transfected into HEK293 cells, together with 0, 35, 70, or 140 ng of sponge plasmid pH19 or pH19mut. Numbers are mean ± SD (n=3). See also Figures S2B and S3A.
Figure 3
Figure 3. H19 associates with miRNPs
(A) Co-IP with mouse monoclonal anti-Ago2 (αAgo2) or preimmune IgG from extracts of retinoic acid (RA)-induced PA-1 cells. RNA levels in immunoprecipitates were determined by reverse transcription and quantitative real-time PCR (RT-qPCR). Top, levels of H19 and beta-actin RNA are presented as fold enrichment in αAgo2 relative to IgG immunoprecipitates. Bottom, relative RNA levels of H19 and beta-actin in RA-induced PA-1. Numbers are mean ± SD (n=3). See also Table S1. (B) Immunoprecipitation using αAgo2 (lane 2) or IgG (lane 3), followed by Western blot analysis using a rabbit monoclonal anti-Ago2. 6% input was loaded in lane 1. The Ago2 band is marked with a red asterisk. Molecular markers in kD are on the left. (C) Schematic outline of purification of H19-associated RNPs and RNA component identification. (D–G) The indicated plasmids (pH19, pH19-S1, or pH19mut) were each transfected into HEK293, with or without cotransfection of iCon or iLet-7. Cells were subjected to in vivo crosslinking, followed by affinity purification of H19-associated RNPs. RNAs extracted from RNPs were subjected to RT-qPCR. Relative abundance of indicated RNAs associated with tagged vs. untagged H19 (or H19mut) are plotted as relative fold enrichment after normalization against beta-tubulin mRNA levels (D, F) or U6B snRNA (RNU6B) levels (E, G). Numbers are mean ± SD (n=3).
Figure 4
Figure 4. H19 modulates expression of endogenous let-7 targets
(A–C) Empty vector or pH19 were transfected into HEK293 cells. Protein and RNA were extracted 48 h later and levels determined by Western blot (A) and RT-qPCR (B, C). In A, the fold increases in the protein levels relative to vector-transfected controls after normalization against beta-actin loading controls are marked on the right. Numbers are mean ± SD (n=3). **, p < 0.01. One-sample t tests were performed to compare each data point with the controls. See also Figure S1C. In B, mRNA levels were normalized against those of beta-actin. Numbers are mean ± SD (n=3). Group t tests were performed to compare means of each mRNA between vector- and pH19-transfected cells. See also Figure S1D. In C, miRNA levels were normalized against those of U6B and presented as mean ± SD (n=3). Group t tests were performed to compare means of each miRNA between vector- and pH19-transfected cells. See also Figure S1E. (D) iCon, iLet-7, vector, or pH19mut were transfected into HEK293 cells. Protein and RNA were extracted 48 h later and levels determined by Western blot (D) and RT-qPCR (E, F). The fold increases in the protein levels relative to controls (iCon- or vector-transfected) after normalization against the beta-actin loading control are marked on the right. Numbers are mean ± SD (n=3).
Figure 5
Figure 5. H19 regulation of let-7 is conserved
(A, B) PA-1 cells were RA-induced to express endogenous H19, followed by siRNA transfection. Cells were subjected to a second transfection 48 h later with psiCHECK2-let-7 4× (column 1) or psiCHECK2-miR20 (column 2), together with 48 nM of let-7. RNA levels (A) and luciferase activities (B) were determined 18 h later. Numbers are mean ± SD (n=3). **, p < 0.01. See also Figure S1F. (C, D) PA-1 cells were induced to express endogenous H19, followed by siRNA transfection. RNA (C) and protein (D) levels were measured 72 h later. Numbers are mean ± SD (n=3). *, p < 0.05. See also Figure S3B, C. (E) Bioinformatics predicted let-7 binding sites at three distinct positions in mouse H19. The nucleotides deleted in psiCHECK2-mH19D are marked in blue. See also Figure S4A–D. (F) Luciferase assay results. Numbers are mean ± SD (n=3).
Figure 6
Figure 6. H19 regulates muscle differentiation in vitro
(A) C2C12 myoblasts were grown in growth medium (GM) or allowed to differentiate for 4 days. RNA and protein were harvested at the indicated time points and analyzed. Top, the expression profiles of H19 RNA and let-7a miRNA were analyzed by RT-qPCR and results are presented with levels at GM set as 1. Numbers are mean ± SD (n=3). Bottom, the expression profiles of muscle differentiation markers myosin heavy chain (MHC) and myogenin are shown by Western blot analysis. ERK1/2 were used as loading controls. (B) C2C12 myoblasts at day 1 differentiation were tranfected with siCon, simH19, or let-7. RNAs were harvested 40 h later and analyzed by RT-qPCR. Relative RNA levels are presented after normalization against beta-tubulin mRNA. Numbers are mean ± SD (n=3). *, p < 0.05; **, p < 0.01. See also Figures S5, S6, and Table S2. (C) Day 1 differentiating C2C12 myoblasts were transfected with siCon, simH19, or let-7. Proteins were harvested 3 days later and analyzed. Representative Western blot gels are shown on the left. Bar graphs on the right are quantitation of three separate Western blot experiments. Numbers are mean ± SD (n=3). *, p < 0.05. (D) MHC staining representative of two separate experiments. (E) Quantitation of myotube formation from D. Numbers are mean ± SD (n=5). **, p < 0.01. (F) RT-qPCR results of differentiating C2C12 myoblasts transfected with siCon, let-7, or simH19 as described in B. Numbers are mean ± SD (n=3). **, p < 0.01. (G) RT-qPCR results of proliferating C2C12 myoblasts transfected with siCon or let-7. Numbers are mean ± SD (n=3). *, p < 0.05.

References

    1. Bartel DP. MicroRNAs: target recognition and regulatory functions. Cell. 2009;136:215–233. - PMC - PubMed
    1. Borensztein M, Monnier P, Court F, Louault Y, Ripoche MA, Tiret L, Yao Z, Tapscott SJ, Forne T, Montarras D, et al. Myod and H19-Igf2 locus interactions are required for diaphragm formation in the mouse. Development. 2013;140:1231–1239. - PMC - PubMed
    1. Boyerinas B, Park SM, Shomron N, Hedegaard MM, Vinther J, Andersen JS, Feig C, Xu J, Burge CB, Peter ME. Identification of let-7-regulated oncofetal genes. Cancer Res. 2008;68:2587–2591. - PubMed
    1. Brannan CI, Dees EC, Ingram RS, Tilghman SM. The product of the H19 gene may function as an RNA. Mol Cell Biol. 1990;10:28–36. - PMC - PubMed
    1. Braun T, Gautel M. Transcriptional mechanisms regulating skeletal muscle differentiation, growth and homeostasis. Nat Rev Mol Cell Biol. 2011;12:349–361. - PubMed

Publication types

MeSH terms

Associated data