. 2013 Dec;31(10):1709-30.
doi: 10.1016/j.mri.2013.07.017. Epub 2013 Sep 20.

The effects of changing water content, relaxation times, and tissue contrast on tissue segmentation and measures of cortical anatomy in MR images

Affiliations

The effects of changing water content, relaxation times, and tissue contrast on tissue segmentation and measures of cortical anatomy in MR images

Ravi Bansal et al. Magn Reson Imaging. 2013 Dec.

Abstract

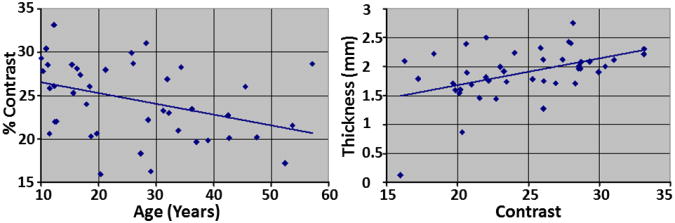
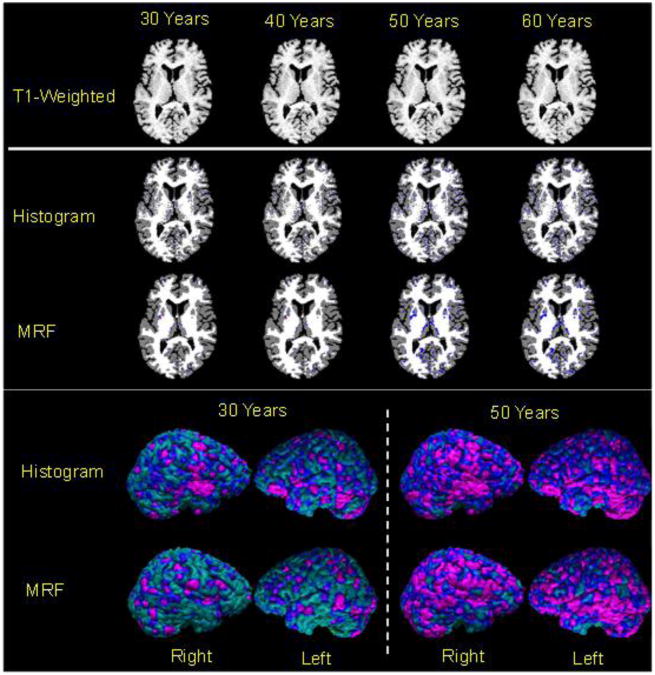
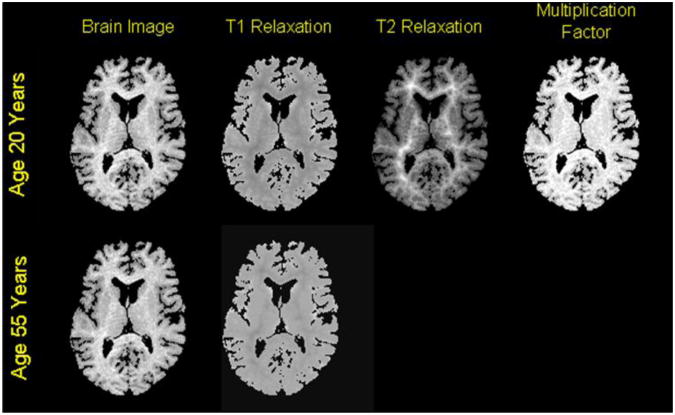
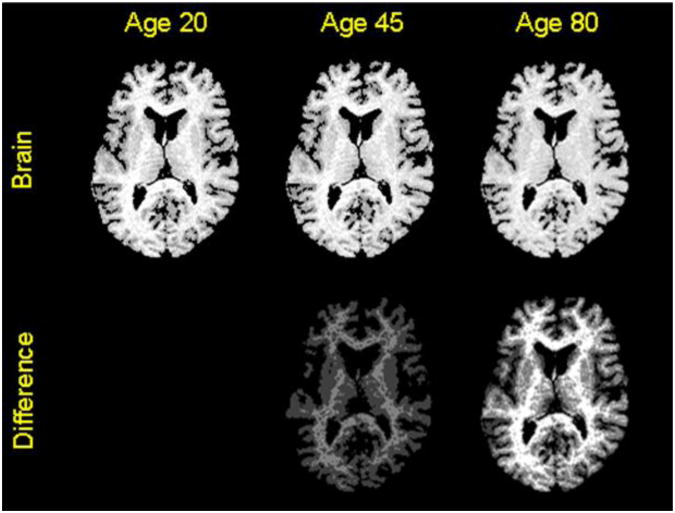
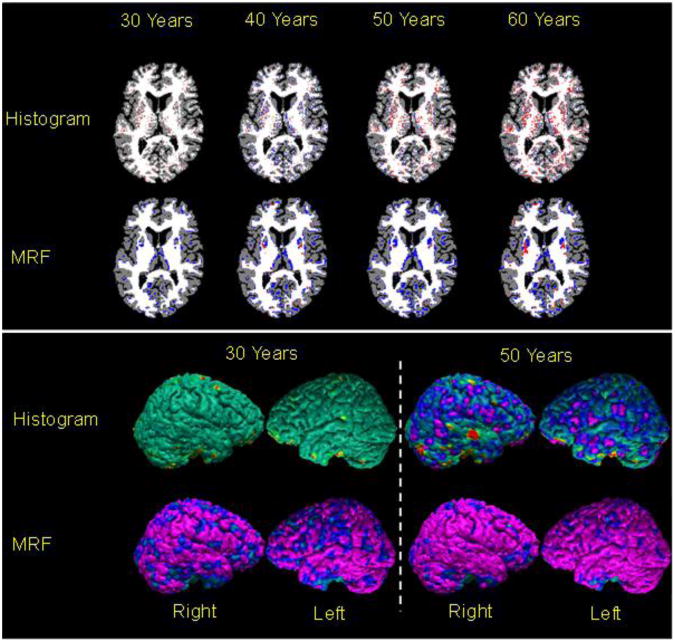
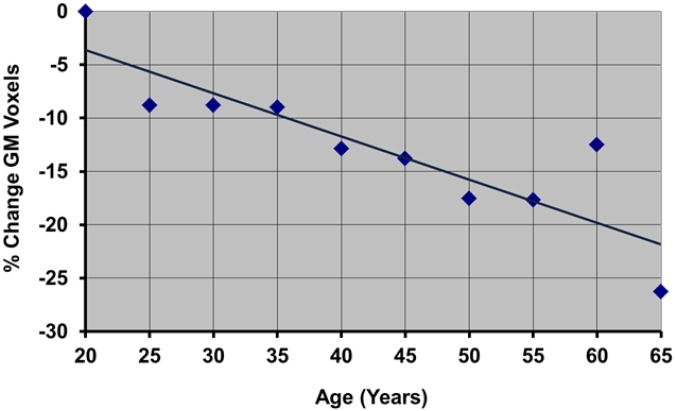
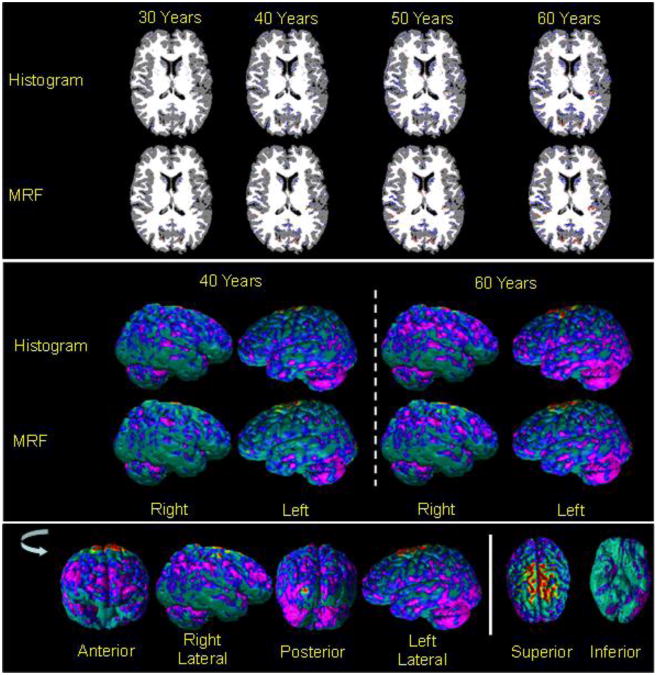
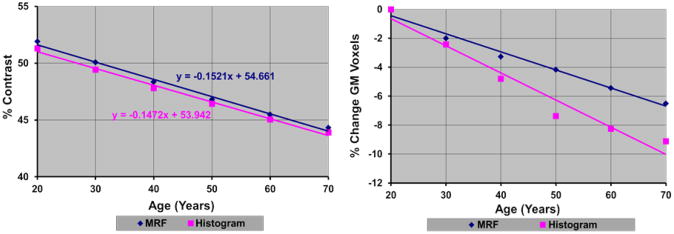
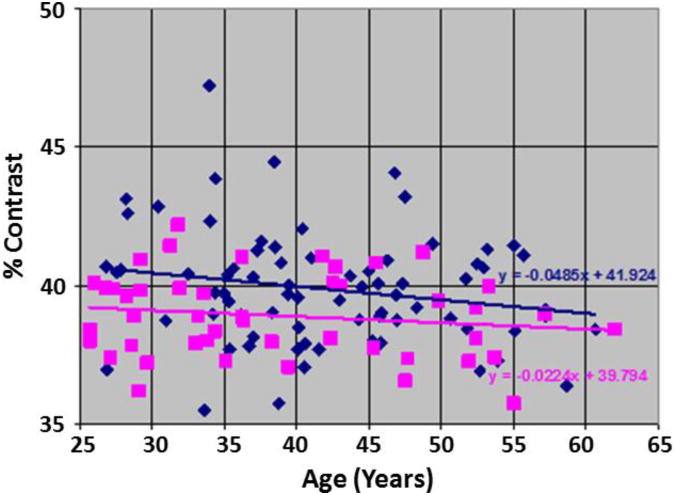
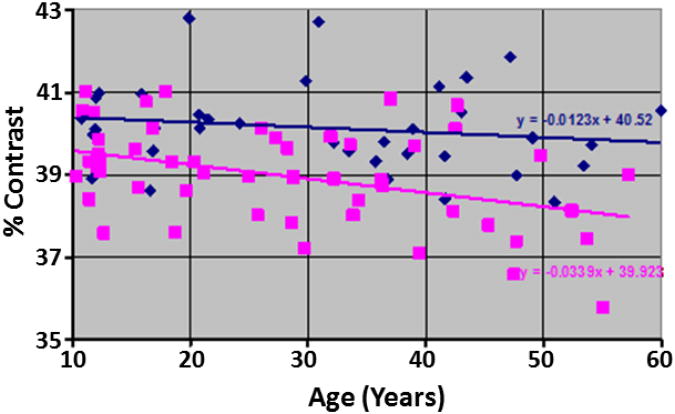
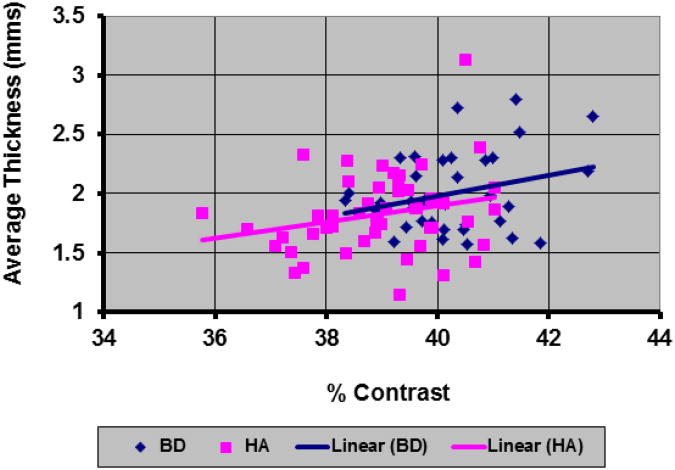
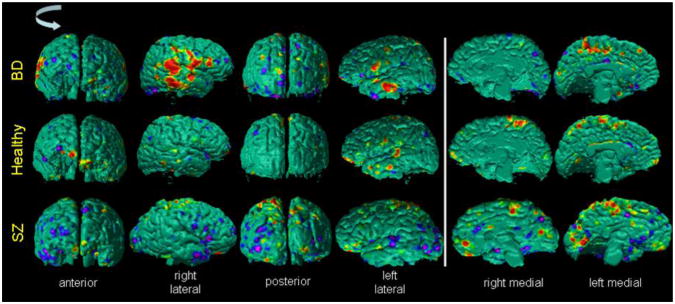
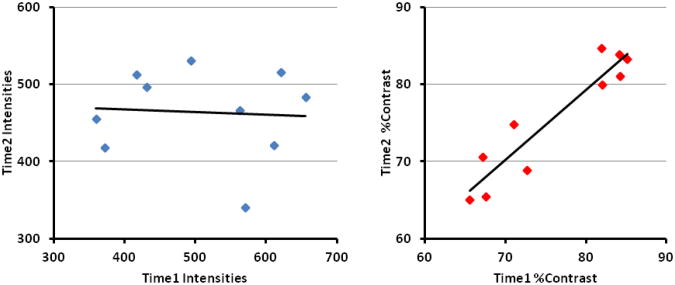
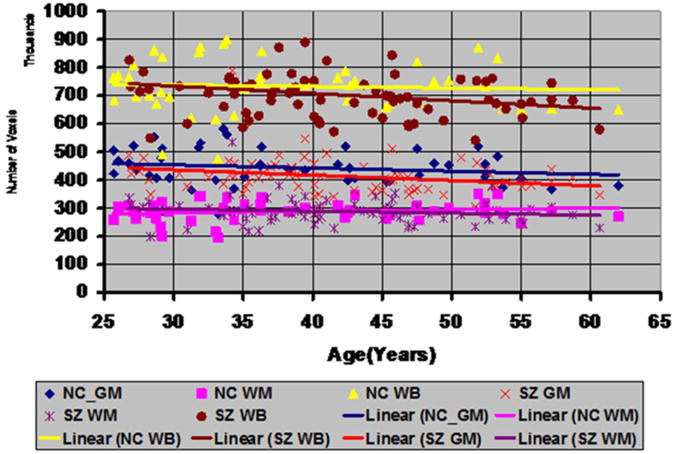
Water content is the dominant chemical compound in the brain and it is the primary determinant of tissue contrast in magnetic resonance (MR) images. Water content varies greatly between individuals, and it changes dramatically over time from birth through senescence of the human life span. We hypothesize that the effects that individual- and age-related variations in water content have on contrast of the brain in MR images also have important, systematic effects on in vivo, MRI-based measures of regional brain volumes. We also hypothesize that changes in water content and tissue contrast across time may account for age-related changes in regional volumes, and that differences in water content or tissue contrast across differing neuropsychiatric diagnoses may account for differences in regional volumes across diagnostic groups. We demonstrate in several complementary ways that subtle variations in water content across age and tissue compartments alter tissue contrast, and that changing tissue contrast in turn alters measures of the thickness and volume of the cortical mantle: (1) We derive analytic relations describing how age-related changes in tissue relaxation times produce age-related changes in tissue gray-scale intensity values and tissue contrast; (2) We vary tissue contrast in computer-generated images to assess its effects on tissue segmentation and volumes of gray matter and white matter; and (3) We use real-world imaging data from adults with either Schizophrenia or Bipolar Disorder and age- and sex-matched healthy adults to assess the ways in which variations in tissue contrast across diagnoses affects group differences in tissue segmentation and associated volumes. We conclude that in vivo MRI-based morphological measures of the brain, including regional volumes and measures of cortical thickness, are a product of, or at least are confounded by, differences in tissue contrast across individuals, ages, and diagnostic groups, and that differences in tissue contrast in turn likely derive from corresponding differences in water content of the brain across individuals, ages, and diagnostic groups.

Keywords: Anatomical MRI; Expectation maximization; Markov random field; Segmentation; Tissue contrast.


Figures

Fig.1
Fig.1. Changes in Tissue Contrast with Age and Changes in Cortical Thickness with Tissue Contrast
In our cohort of 43 healthy participants (age 10 years to 57 years), tissue percent contrast decreased 0.124 per year (p < 0.02) and cortical thickness increased 0.0462mm per year (p = 0.002) with increasing contrast. The percent tissue contrast was computed as (AveWM-AveGM)/AveGM * 100, where AveWM is the average intensity in white matter (WM) and AveGM is the average intensity in gray matter (GM). Average cortical thickness was computed by averaging thickness at each voxel across the entire surface of the brain. These plots showed that the tissue contrast decreased with age and that automated methods for tissue segmentation defined thicker cortex in MR images with higher tissue contrast.
Fig.2
Fig.2. Voxelwise Changes in Cortical Thickness with Increasing Age
Using a T1-weighted MR image, called the baseline image, from the brain of a 20-year old healthy adult, we generated a set of brain images with decreasing tissue contrast. The percent tissue contrast (AveWM-AveGM)/AveGM*100 was decreased by 0.13/year (Fig.1) by increasing the average intensity of gray matter (GM) and while holding constant the gray scale intensities of white matter (WM). In these maps, purple and blue encoded thinner cortex, and red and yellow encoded thicker cortex in the reconstructed images as compared to the baseline cortex. Top Row: Visually, T1-weighted images showed that tissue contrast decreased slightly with age. Brain tissue in the synthetically generated images was segmented using either a histogram-based or a Markov Random Field (MRF)-based method for tissue segmentation. We subtracted the definition of the baseline cortex from the cortex definitions in brains at other ages and color encoded voxelwise the statistically significant differences from the baseline image (Rows 2 and 3) and on the surface of the baseline brain (Rows 4 and 5). These plots showed that both methods of tissue segmentation defined thinner cortices in images with lower tissue contrast.
Fig.3
Fig.3. T1-Weighted Images Reconstructed from Synthetic Maps of Relaxation Times
We reconstructed T1-weighted images of the brain for various ages using (1) T1-weighted image, called the baseline image, of a 20-year old healthy adult, and (2) typical values for T1 and T2 relaxation times of GM and WM in a 1.5T scanner. T1-weighted images at increasing ages were simulated from relaxation times appropriate for that age. Top Row: Images from left to right are (1) the T1-weighted image of a healthy adult, (2) the synthetic map of T1 relaxation time, (3) the synthetic map of T2 relaxation time, and (3) the computed map of multiplication factor. Bottom Row: Images from left to right are (1) the reconstructed, T1-weighted image, and (2) the simulated map of T1 relaxation times for age 55 years.
Fig.4
Fig.4. Visualizing Reconstructed Images at Various Ages
Top Row: The T1-weighted images reconstructed from the synthetic maps of relaxation times at ages 45 and 80 years show decreasing tissue contrast that we observed in images in our cohort of 43 healthy adults (Fig. 1). Bottom Row: We computed maps of the differences in pixel intensities between (1) the baseline image at age 20 years and the reconstructed image at age 45 years, and (2) the baseline image at age 20 years and the reconstructed image at age 80 years. The maximum intensity in the image at age 20 years was 90, and the maximum intensity in the difference image was 2 at age 45 years and was 4 at age 80 years. Therefore, the change in relaxation times caused only subtle changes (less than 5%) in tissue intensities with age, with intensities only changing across WM in images reconstructed for early ages.
Fig.5
Fig.5. Changes in the Cortical Thickness in Images Reconstructed from the Synthetic Maps of Relaxation Times
In T1-weighted images reconstructed from synthetic maps of relaxation times, voxels were labeled as GM or WM in the reconstructed images using either a histogram-based or a MRF-based method for tissue segmentation. The baseline cortex was subtracted from the definitions of the cortex in reconstructed images and we color encoded the voxelwise difference using the coding in Fig.2. Top Two Rows: Voxelwise difference in the reconstructed cortex as compared with the baseline cortex. Bottom Two Rows: The differences in the cortical thickness were mapped onto the surface of the baseline image. Both the voxelwise maps and the surface maps show that the automated methods defined thinner cortex in images with lower tissue contrast with increasing age. Furthermore, the thinning was more pronounced for the cortex defined using the MRF-based method as compared to the cortex defined by the histogram-based method for segmentation.
Fig.6
Fig.6. Plot of the Percent Change in Voxels Labeled as GM Using MRF-Based Tissue Segmentation
in brain images reconstructed from synthetic maps of relaxation times. The plot shows a 25% decrease in the number of voxels labeled as GM over a period of 45 years.
Fig.7
Fig.7. Cortical Thickness In Images Reconstructed from Maps of Relaxation Times for a Healthy Adult
Using T1-weighted image and maps of T1 and T2 relaxation times for a healthy adult, we generated maps of relaxation times at various ages by varying the T1 relaxation times and water content with age. We then applied either the histogram-based or the MRF-based methods for tissue segmentation and generated the voxelwise (Rows One and Two) and surface maps (Rows Three and Four) of difference in the cortical thickness at increasing age compared to the cortical thickness at age 20 years. The bottom row shows the various views of the surface plot as the brain in rotated anticlockwise and the views from the superior and inferior directions. The difference in the cortical thickness was color encoded using the coding in Fig.2. These maps showed that the decrease in cortical thickness was regionally specific, with bilateral decrease in the prefrontal cortex, posterior and inferior parietal cortex, and the cerebellum, and with bilateral increases in thickness at the vertex of the brain. Cortical thickness increased at the vertex due to spatial variations in relaxation times across the brain.
Fig.8
Fig.8. Tissue Contrast and GM Voxels in the Cortex in Images Reconstructed Using Maps of Relaxation Times in a Healthy Adult
The plots show differential change in relaxation times decreased percent tissue contrast, which in turn decreased the number of voxels labeled as GM. In addition, the rate of decrease in tissue contrast matched the rate of decrease in contrast measured empirically in our real-world sample of healthy participants (Fig.1). Thus, changes in relaxation times alone can account for the previously reported, age-related decline in cortical thickness.
Fig.9
Fig.9. Tissue Contrast in Healthy Participants and Persons with Schizophrenia (SZ)
In our sample of 46 healthy adults (HA) and 74 adults with SZ, a plot of percent tissue contrast with age showed that the T1-weighted images for SZ adults had higher tissue contrast compared to the images for the healthy adults. After controlling for age and sex using multiple linear regression, the contrast in SZ brains was higher by 1.03 (p < 0.05) than the healthy brains. In addition, the percent contrast decreased at a rate of −0.035 per year, which was statistically significant (P-value = 0.031). We computed contrast by using the average GM and WM tissue intensities and therefore the tissue contrast is largely invariant to the random scanner noise. Because the MR images were acquired on the same MRI scanner with identical pulse sequences, the variations in tissue contrast across participants are primarily due to physiological variations in the brain across participants. The variations in scanner characteristics and noise will have only a small influence on measurement variations in tissue contrast. Furthermore, the linear fit best explains the change in contrast with age both visually and our derivations that predicted a linear relation between change in tissue contrast and relaxation times. The rate of change in contrast was less than that in our other cohort of healthy participants (Fig.1) because they were older than the healthy adults of our cohort. HA=Healthy Adult; SZ=Schizophrenia
Fig.10
Fig.10. The Surface Maps of Differences in Cortical Thickness Between SZ Adults and Healthy Adults
We compared cortical thickness in our cohort of 46 healthy adults to those of 74 adults with Schizophrenia (SZ), while controlling for the effects of gender and whole brain volume. The P-values of the differences in the cortical thickness were color encoded and displayed on the surface of the brain. Red and yellow color indicated significant (P-value < 0.05) increases and purple and blue indicate significant decreases (P-value < 0.05) in cortical thickness of SZ adults. These maps indicated that SZ adults had thicker cortex in the lateral aspects and thinner cortex in the superior parietal regions of the brain. The thicker cortex in SZ adults were expected because the SZ adults had higher tissue contrast (Fig.9) than healthy adults and because our previous results had shown that the automated methods defined thicker cortex in images with higher tissue contrast (Figs. 2, 5, & 7). In addition, the spatial pattern of the between-group differences in thickness matches the spatial pattern of change in thickness with decreasing tissue contrast (Fig.7), thereby suggesting that the differences in between-group tissue contrast at least confounded the between-group differences in cortical thickness. HA=Healthy Adult; SZ=Schizophrenia
Fig.11
Fig.11. The Change in Tissue Contrast With Age
in our cohort of 52 healthy participants (HA; 25 males, age 27.71±14.1 years) and 36 participants with Bipolar Disorder (BD; 17 males, age 31.38±14.67 years). Using multiple linear regression to control for age, gender, and diagnosis, the percent contrast was higher by 1.24 in BD participants as compared to the healthy participants (P-value = 1.07 * 10−6). And similar to the SZ participants, the contrast did not differ (P-value = 0.3155) between males and females in this cohort of participants. Furthermore, although the percent contrast decreased at a rate of -0.012 per year for BD participants, the decrease in contrast was not statistically significant (P-value = 0.34). However, within healthy participant, the decrease in contrast with age was statistically significant (P-value = 0.0032). Purple Squares: Healthy Participants; Blue Diamonds: Participants with BD. HA=Healthy Adult; BD=Bipolar Disorder
Fig.12
Fig.12. The Maps of Difference in Cortical Thickness Between Healthy Participants and Participants with Bipolar Disorder (BD)
In our cohort of 52 healthy adults (HA) and 36 participants with Bipolar Disorder (BD) we computed cortical thickness. At each point on the template surface, we used multiple linear regression to correlate cortical thickness with diagnosis while controlling for the age and gender effects. The P-values were color encoded and displayed on the surface, with red and yellow showing thicker cortex and purple and blue showing thinner cortex in BD participants. These maps showed that bilaterally the BD participants had thicker cortex in the lateral aspect and thinner cortex in the vertex of the brain. The spatial pattern of the differences in cortical thickness matched the spatial pattern of the change in cortical thickness with tissue contrast (Fig.7) and was similar to the spatial pattern of differences in thickness between adults with Schizophrenia (SZ) and healthy adults (Fig.10). The BD participants had higher tissue contrast as compared to the age- and sex-matched healthy participants (Fig.13), thereby suggesting the observed differences in the thickness in BD participants compared to the healthy participants. HA=Healthy Adult; BD=Bipolar Disorder
Fig.13
Fig.13
The Change in Average Cortical Thickness with Tissue Contrast in our cohort of 52 healthy adults (HA) and 36 participants with Bipolar Disorder (BD). We computed the average cortical thickness in the participant brains that were not scaled for the whole brain volumes and segmented the brain tissue as gray matter (GM) and white matter (WM) using the automated method based on histogram of tissue intensity. These plots showed that the average cortical thickness was significantly correlated (BD: Pearson r = 0.277, P-value = 0.046; HA: Pearson r = 0.24, P-value = 0.043) with tissue contrast. In addition, BD participants had thicker cortex (P-value = 0.015) and higher tissue contrast (P-value = 1.07 * 10−6) compared to the healthy participants. HA=Healthy Adult; BD=Bipolar Disorder
Fig.14
Fig.14. The Maps of Change in Cortical Thickness with Tissue Contrast
while controlling for the effects of sex. We applied multiple linear regression at each point on the surface of the brain with the cortical thickness as the independent variable and the tissue contrast and sex as the independent variables. Age was not used as an independent variable because it correlated significantly with contrast (Fig. 1). We generated these color maps independently for the 38 participants with Bipolar Disorder (BD, Top Row), 58 healthy participants (Middle Row), and 74 adults with Schizophrenia (SZ, Bottom Row). The P-value maps were controlled for false positive due to multiple comparisons by applying a method for False Discovery Rate (FDR) with the false discovery rate set at 0.05. These maps showed that although there were few localized brain regions with negative associations, especially in the adults with SZ, in general changes in cortical thickness were positively associated with tissue contrast. Thus, automated tools for tissue segmentation defined thicker cortex in brain images with higher tissue contrast in each of our three independent sets of brains from healthy participants, participants with BD, and adults with SZ. SZ = Schizophrenia; BD = Bipolar Disorder
Fig.15
Fig.15. Gray Matter Intensities and Percent Tissue Contrast Measured in the Same Individuals at Two Time Points
We measured and plotted the average gray matter (GM) intensities and the percent tissue contrast in the brains of 10 participants (9 females, age range 12.03 to 17.76 years) for whom we acquired two scans at a 3-month interval. Although the tissue intensities were not correlated (Pearson r=0.07, P-value=0.86) at the two time points, the percent contrasts were nearly perfectly correlated (Pearson r=0.94, P-value=1.42 × 10⁻⁵) across time, differing by less than 5% within participants. For a single individual, possible sources of variance across time points included (1) changes in scanner characteristics, including amplifier gain, over time, (2) noise in the imaging data, and (3) changes in the brain physiology over the three-month interval between scans (which seems highly unlikely). The younger adolescents (ages 12.03 to 14.4 years) had a higher percent contrast (>81), whereas the older adolescents (ages (14.88 to 17.76 years) had a lower percent contrast (<75) at both time points, as we had expected. Furthermore, this plot demonstrated that tissue contrast can differ across individuals of similar ages by more than 30% based on physiological differences (the average Time1 contrast was 76.12±8.05). Because tissue contrast depends only on relaxation times, we surmise that relaxation times vary across individuals because of physiological differences in their brains.
Fig.16
Fig.16. The Change in the Whole Brain Volume and Tissue Volumes with Age
in healthy adults and adults with SZ. We applied the histogram-based method to segment the brain as gray matter (GM) and white matter (WM) in our cohort of 46 healthy adults (HA) and 74 adults with Schizophrenia (SZ). These plots showed that from age 25 years to age 65 years in healthy adults the WBV decreased by 2.9% (yellow triangles, Pearson r = −0.06 P-value = 0.35), the GM volume decreased by 9.78% (blue diamonds, , Pearson r = −0.173, P-value = 0.125), and the WM volume increased by 8.21% (purple squares, , Pearson r = 0.156, P-value = 0.148). In SZ adults, the WBV decreased by 14.05% (brown circles, Pearson r = −0.215, P-value = 0.033), the GM volume decreased by 16.9% (red cross, Pearson r = −0.247, P-value=0.017), and the WM volume decreased by 9.69% (violet cross, Pearson r = −0.13, P-value = 0.13). Although in healthy adults the volumes did not change significantly with age, similar to other reported studies, volume changes may not be significant because of small age range (40 years from age 25 years to age 65 years) and because brain maturation due to developmental changes are typically completed by the second decade of life. Yet, the data showed that at age 25 years the WBV of adults with SZ matched the WBV of healthy adults and that for healthy adults the WBV decreased by 2.9% over the period of 40 years, which was close the 4.5% decrease in WBV in another study for the same age range in healthy adults. HA=Healthy Adult; SZ=Schizophrenia
Fig.17
Fig.17. The Change in Tissue Volumes with Age of Participants with Bipolar Disorder (BD)
We isolated the brain in T1-weighted images and labeled the brain tissue as gray matter (GM) or white matter (WM) by applying the histogram-based method for segmentation. From age 10 years to age 60 years, the whole brain volume (WBV) decreased by 9.95% (red crosses, Pearson r = -0.242, P-value = 0.07), the GM volume decreased by 18.99% (yellow triangles, Pearson r = -0.4338, P-value = 0.0032), and the WM volume increased by 4.36% (brown circles, Pearson r = 0.0724, P-value = 0.3328). Although the Pearson correlation for the increase in WM volume was small and therefore not statistically significant, the volumes of GM and WM decreased significantly with age.

References

    1. Hallgren B, Sourander P. The Effect of Age on the Non-Haemin Iron in the Human Brain. Journal of Neurochemistry. 1958;3(1):41–51. - PubMed
    1. Bottomley PA, Foster TH, Argersinger RE, Pfeifer LM. A Review of Normal Tissue Hydrogen NMR Relaxation-Times and Relaxation Mechanisms from 1-100 Mhz - Dependence on Tissue-Type, NMR Frequency, Temperature, Species, Excision, and Age. Medical Physics. 1984;11(4):425–448. - PubMed
    1. Rooney WD, Johnson G, Li X, et al. Magnetic field and tissue dependencies of human brain longitudinal 1H20 relaxation in vivo. Magnetic Resonance in Medicine. 2007 Feb;57(2):308–318. - PubMed
    1. Powchik P, Davidson M, Haroutunian V, et al. Postmortem studies in schizophrenia. Schizophrenia Bulletin. 1998;24(3):325–341. - PubMed
    1. Chance SA, Esiri MM, Crow TJ. Amygdala volume in schizophrenia: post-mortem study and review of magnetic resonance imaging findings. British Journal of Psychiatry. 2002 Apr;180:331–338. - PubMed

Publication types