

The actions of Pasteurella multocida toxin on neuronal cells
- PMID: 24055502
- PMCID: PMC3878393
- DOI: 10.1016/j.neuropharm.2013.09.005
The actions of Pasteurella multocida toxin on neuronal cells
Abstract
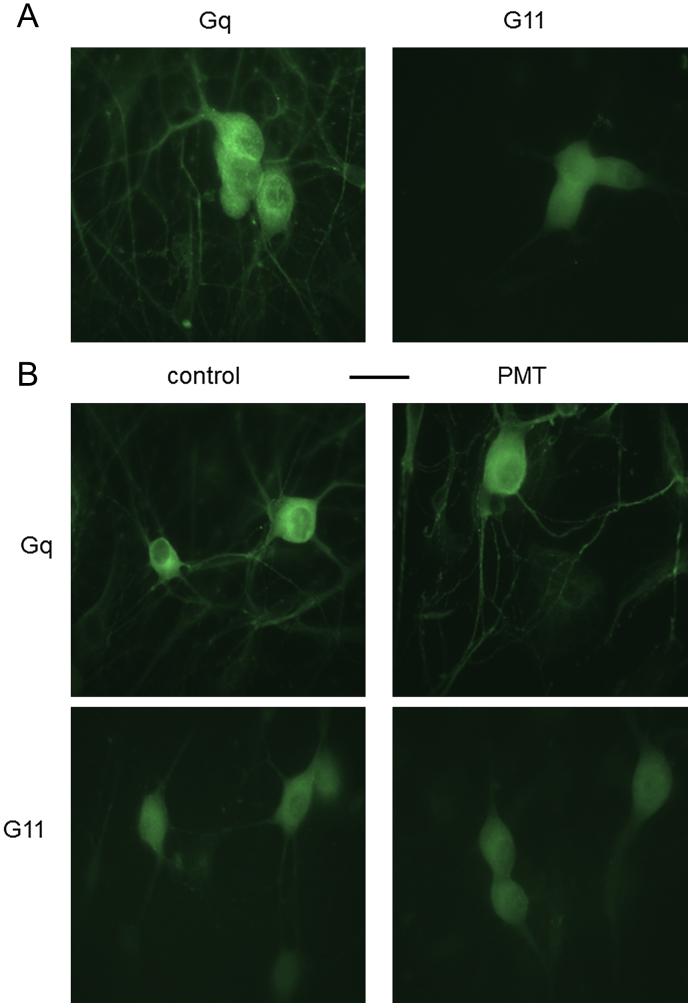
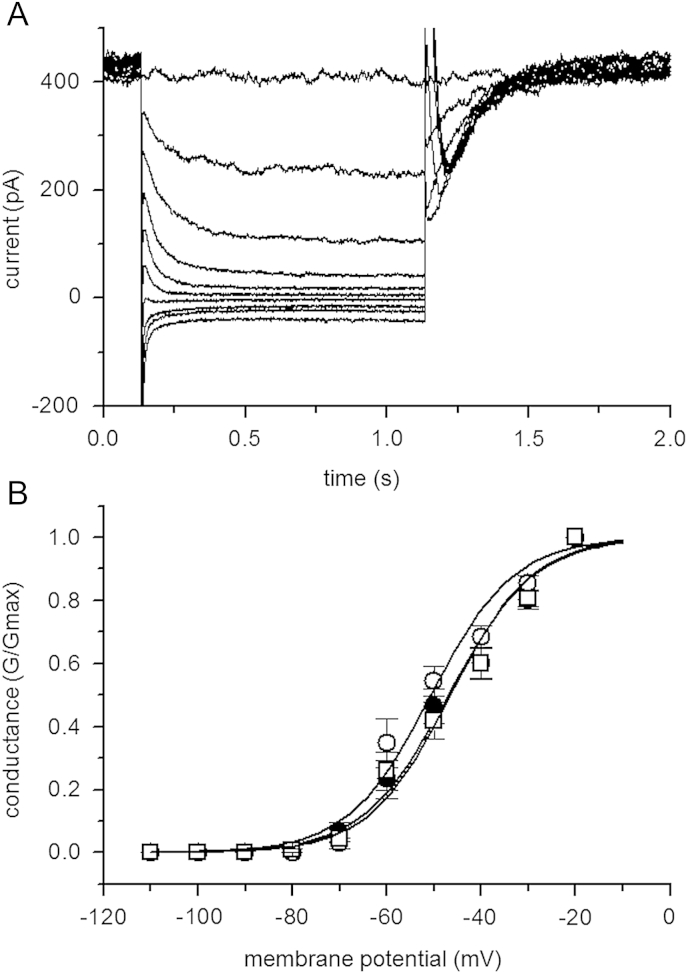
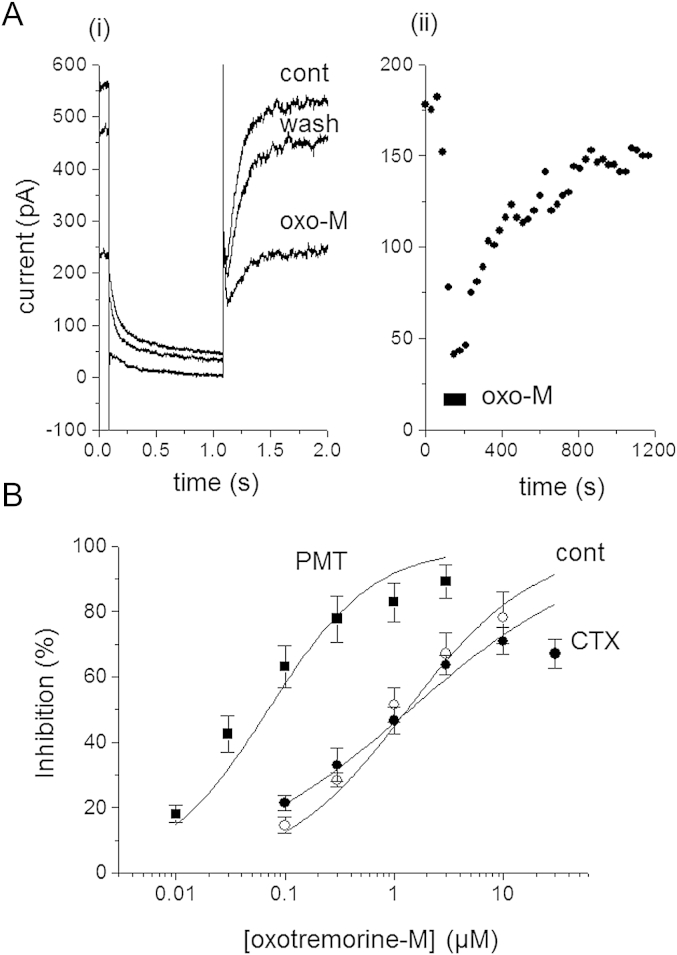
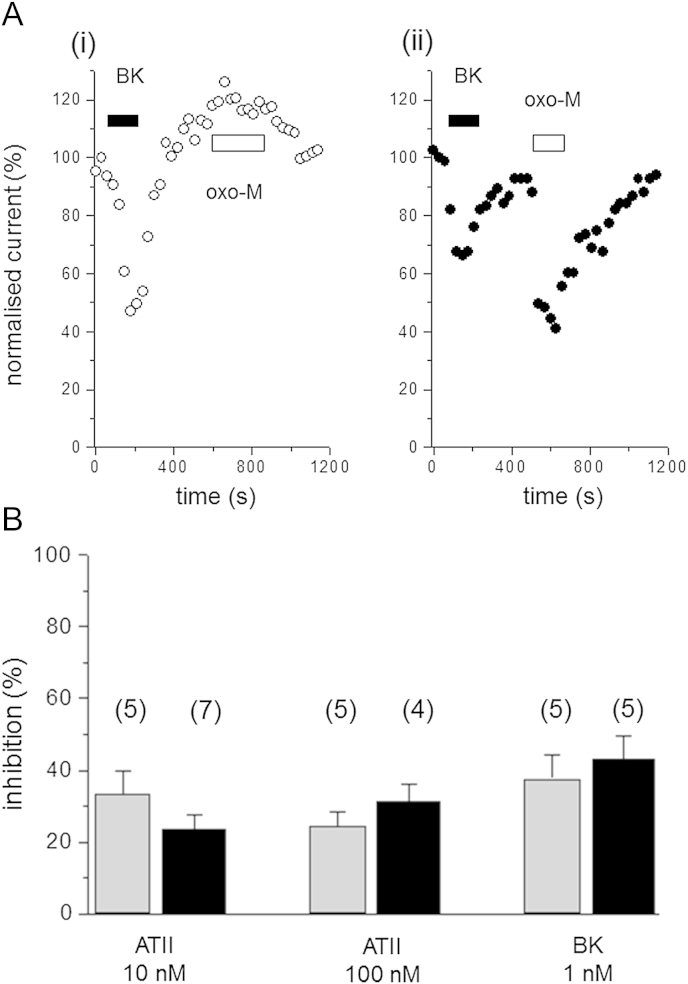
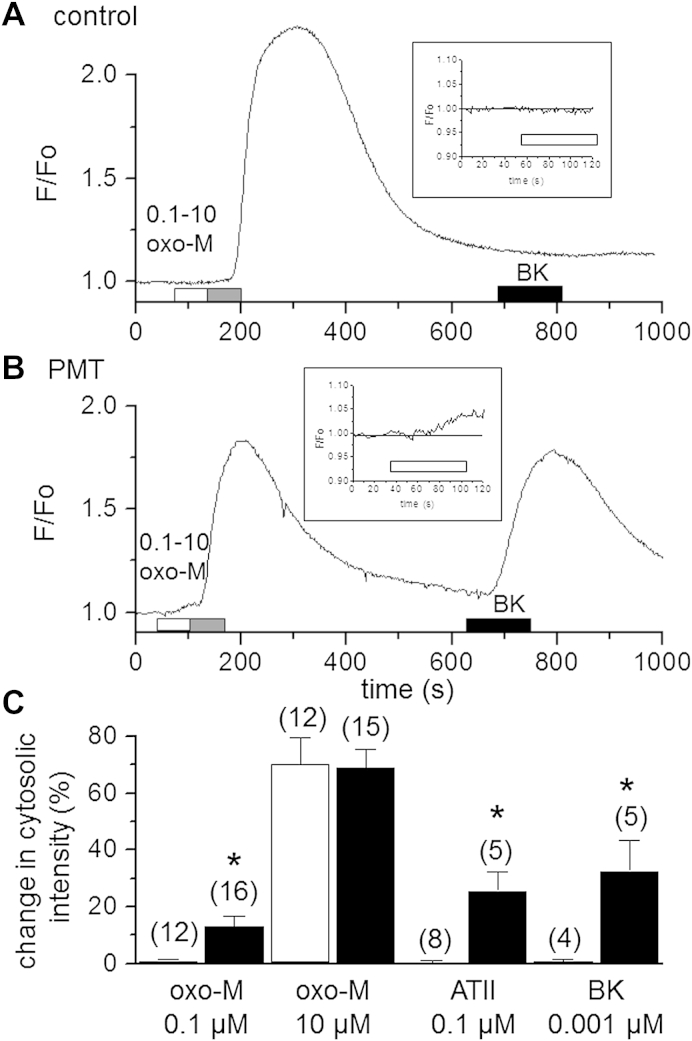
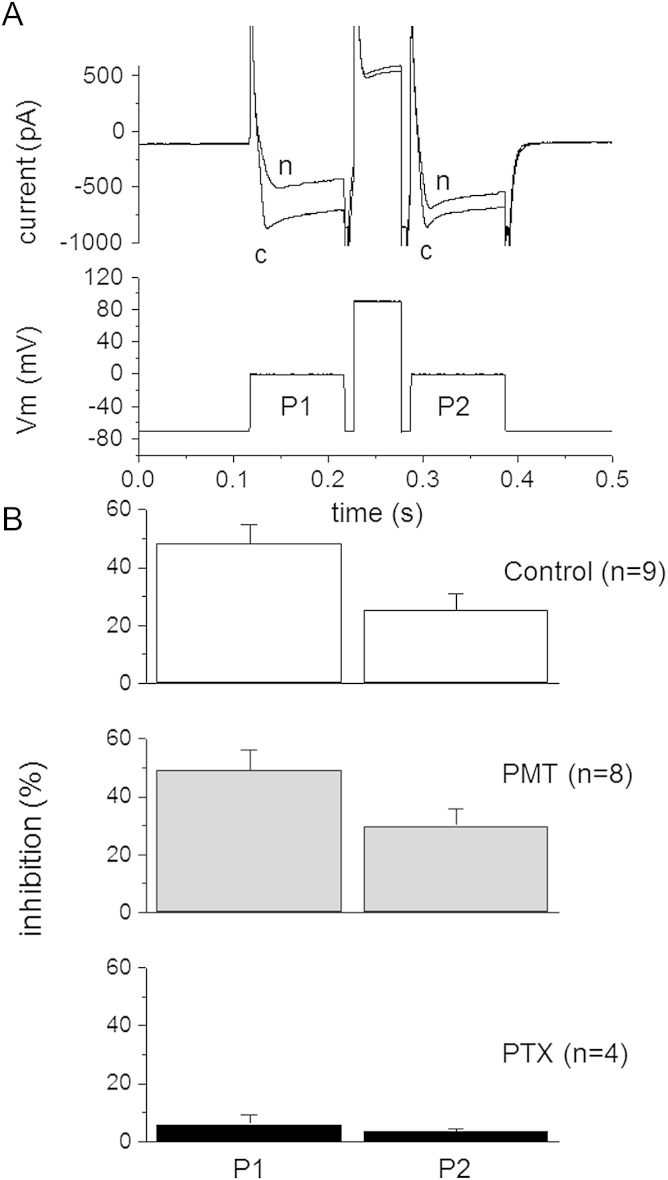
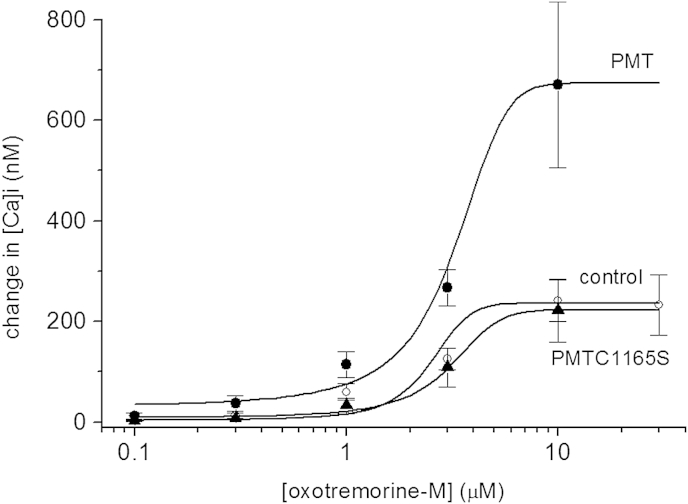
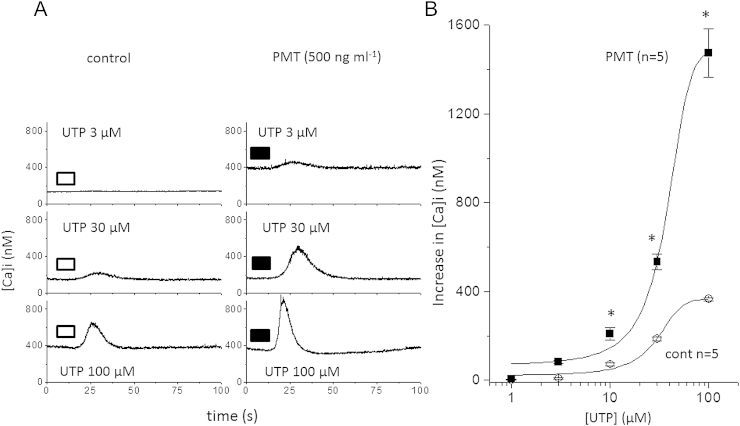
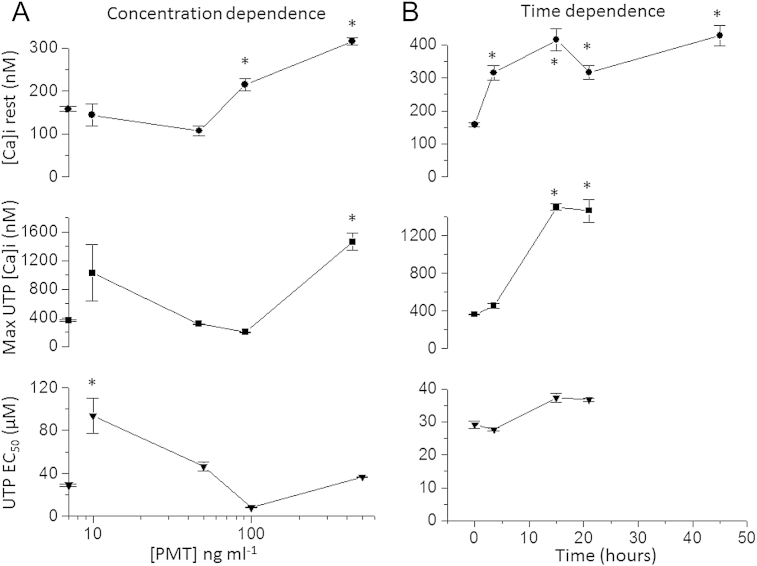
Pasteurella multocida toxin (PMT) activates the G-proteins Gαi(₁₋₃), Gα(q), Gα₁₁, Gα₁₂ and Gα₁₃ by deamidation of specific glutamine residues. A number of these alpha subunits have signalling roles in neurones. Hence we studied the action of this toxin on rat superior cervical ganglion (SCG) neurones and NG108-15 neuronal cells. Both Gα(q) and Gα₁₁ could be identified in SCGs with immunocytochemistry. PMT had no direct action on Kv7 or Cav2 channels in SCGs. However PMT treatment enhanced muscarinic receptor mediated inhibition of M-current (Kv7.2 + 7. 3) as measured by a 19-fold leftward shift in the oxotremorine-M concentration-inhibition curve. Agonists of other receptors, such as bradykinin or angiotensin, that inhibit M-current did not produce this effect. However the amount of PIP₂ hydrolysis could be enhanced by PMT for all three agonists. In a transduction system in SCGs that is unlikely to be affected by PMT, Go mediated inhibition of calcium current, PMT was ineffective whereas the response was blocked by pertussis toxin as expected. M1 muscarinic receptor evoked calcium mobilisation in transformed NG108-15 cells was enhanced by PMT. The calcium rises evoked by uridine triphosphate acting on endogenous P2Y₂ receptors in NG108-15 cells were enhanced by PMT. The time and concentration dependence of the PMT effect was different for the resting calcium compared to the calcium rise produced by activation of P2Y₂ receptors. PMT's action on these neuronal cells would suggest that if it got into the brain, symptoms of a hyperexcitable nature would be seen, such as seizures.
Keywords: Calcium current; G-protein; Intracellular calcium; Kv7 channels; M-current; Muscarinic receptors; NG108-15 cells; Neurones; P2Y receptors; Pasteurella multocida toxin; Superior cervical ganglion cell.
Copyright © 2013 The Authors. Published by Elsevier Ltd.. All rights reserved.
Figures
Similar articles
-
Pasteurella multocida toxin-induced activation of RhoA is mediated via two families of G{alpha} proteins, G{alpha}q and G{alpha}12/13.J Biol Chem. 2005 Nov 4;280(44):36701-7. doi: 10.1074/jbc.M507203200. Epub 2005 Sep 1. J Biol Chem. 2005. PMID: 16141214
-
Action of Pasteurella multocida toxin on Galpha(q) is persistent and independent of interaction with G-protein-coupled receptors.Cell Signal. 2007 Oct;19(10):2174-82. doi: 10.1016/j.cellsig.2007.06.016. Epub 2007 Jun 29. Cell Signal. 2007. PMID: 17669624
-
Pasteurella multocida toxin activates Gbetagamma dimers of heterotrimeric G proteins.Cell Signal. 2009 Apr;21(4):551-8. doi: 10.1016/j.cellsig.2008.12.007. Epub 2008 Dec 24. Cell Signal. 2009. PMID: 19135527
-
Pasteurella multocida toxin as a tool for studying Gq signal transduction.Rev Physiol Biochem Pharmacol. 2004;152:93-109. doi: 10.1007/s10254-004-0032-6. Epub 2004 Sep 29. Rev Physiol Biochem Pharmacol. 2004. PMID: 15455260 Free PMC article. Review.
-
The pasteurella multocida toxin interacts with signalling pathways to perturb cell growth and differentiation.Int J Med Microbiol. 2004 Apr;293(7-8):505-12. doi: 10.1078/1438-4221-00287. Int J Med Microbiol. 2004. PMID: 15149025 Review.
Cited by
-
CXCL8 Knockout: A Key to Resisting Pasteurella multocida Toxin-Induced Cytotoxicity.Int J Mol Sci. 2024 May 14;25(10):5330. doi: 10.3390/ijms25105330. Int J Mol Sci. 2024. PMID: 38791369 Free PMC article.
-
Revealing the lethal effects of Pasteurella multocida toxin on multiple organ systems.Front Microbiol. 2024 Aug 27;15:1459124. doi: 10.3389/fmicb.2024.1459124. eCollection 2024. Front Microbiol. 2024. PMID: 39257615 Free PMC article.
-
In Vivo Targets of Pasteurella Multocida Toxin.Int J Mol Sci. 2020 Apr 15;21(8):2739. doi: 10.3390/ijms21082739. Int J Mol Sci. 2020. PMID: 32326543 Free PMC article.
-
Reduced habenular volumes and neuron numbers in male heroin addicts: a post-mortem study.Eur Arch Psychiatry Clin Neurosci. 2021 Aug;271(5):835-845. doi: 10.1007/s00406-020-01195-y. Epub 2020 Oct 1. Eur Arch Psychiatry Clin Neurosci. 2021. PMID: 33001272
-
Hawkmoth Pheromone Transduction Involves G-Protein-Dependent Phospholipase Cβ Signaling.eNeuro. 2025 Mar 7;12(3):ENEURO.0376-24.2024. doi: 10.1523/ENEURO.0376-24.2024. Print 2025 Mar. eNeuro. 2025. PMID: 39880675 Free PMC article.
References
-
- Baldwin M.R., Lakey J.H., Lax A.J. Identification and characterization of the Pasteurella multocida toxin translocation domain. Mol. Microbiol. 2004;54:239–250. - PubMed
-
- Baldwin M.R., Pullinger G.D., Lax A.J. Pasteurella multocida toxin facilitates inositol phosphate formation by bombesin through tyrosine phosphorylation of Gαq. J. Biol. Chem. 2003;278:32719–32725. - PubMed
-
- Blocker D., Berod L., Fluhr J.W., Orth J., Idzko M., Aktories K., Norgauer J. Pasteurella multocida toxin (PMT) activates RhpGTPases, induces action polymerization and inhibits migration of human dendritic cells, but does not influence macropinocytosis. Int. Immunol. 2006;18:459–464. - PubMed
Publication types
MeSH terms
Substances
Grants and funding
LinkOut - more resources
Full Text Sources
Other Literature Sources
