

Absolute quantification of UGT1A1 in various tissues and cell lines using isotope label-free UPLC-MS/MS method determines its turnover number and correlates with its glucuronidation activities
- PMID: 24055854
- PMCID: PMC4010308
- DOI: 10.1016/j.jpba.2013.08.024
Absolute quantification of UGT1A1 in various tissues and cell lines using isotope label-free UPLC-MS/MS method determines its turnover number and correlates with its glucuronidation activities
Abstract
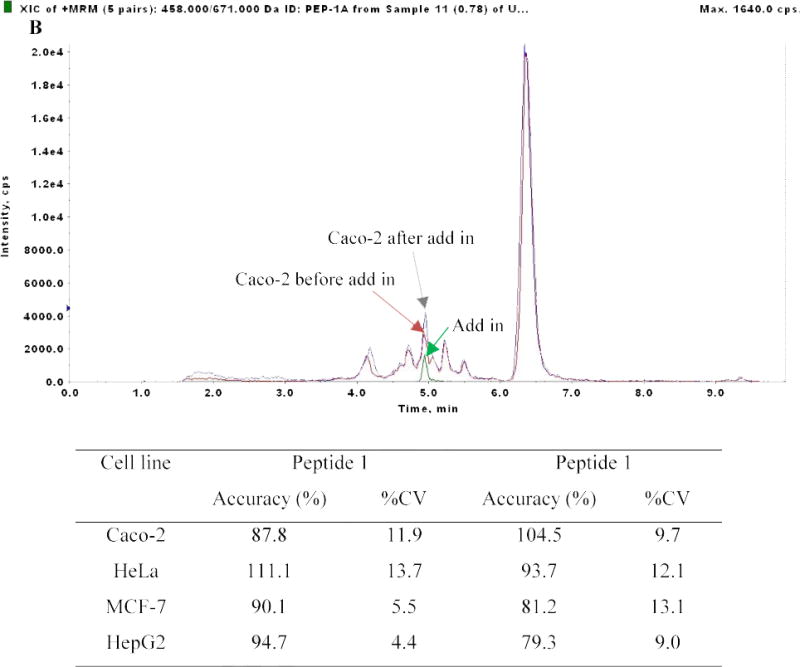
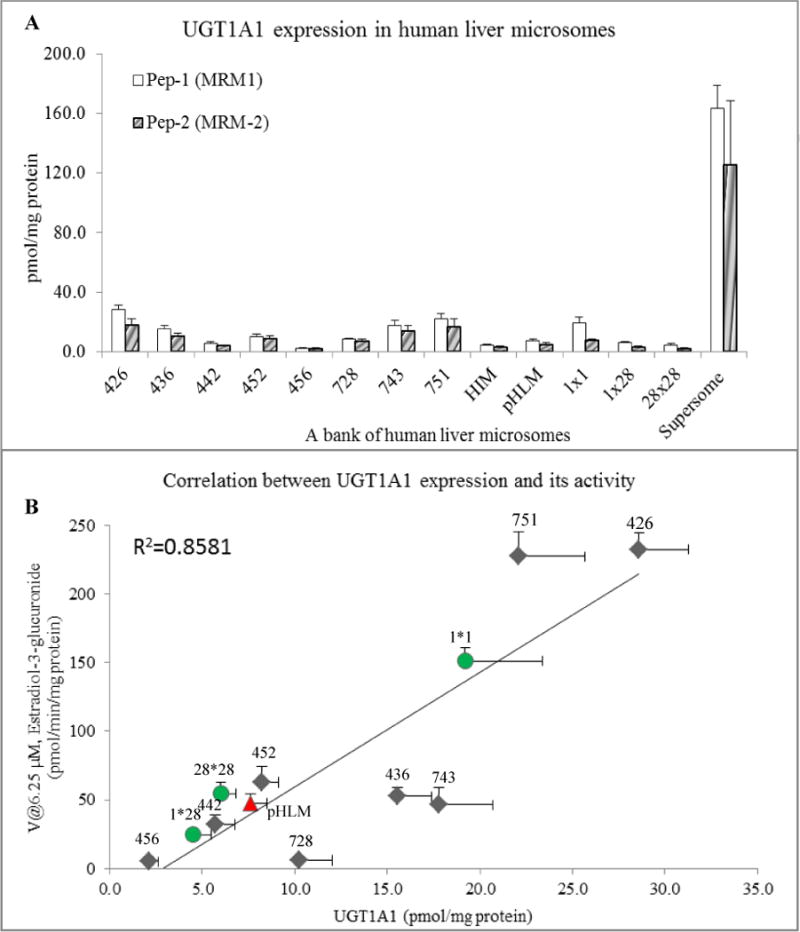
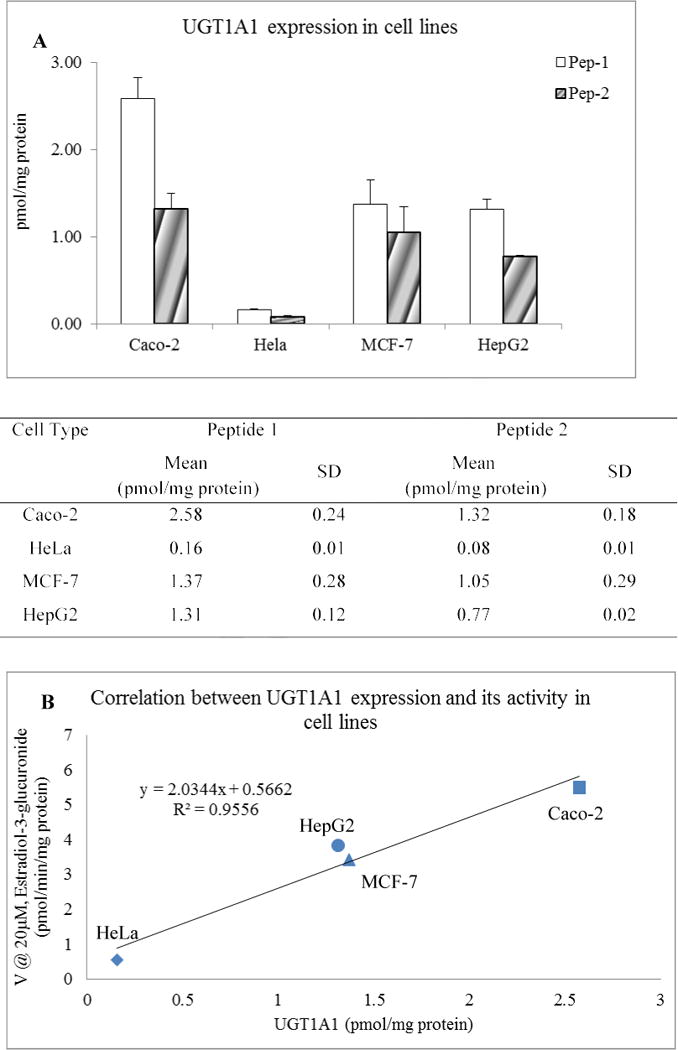
Uridine 5'-diphosphate-glucuronosyltransferase (UGT)1A1 is a major phase II metabolism enzyme responsible for glucuronidation of drugs and endogenous compounds. The purpose of this study was to determine the expression level of UGT1A1 in human liver microsomes and human cell lines by using an isotope label-free LC-MS/MS method. A Waters Ultra performance liquid chromatography (UPLC) system coupled with an API 5500Qtrap mass spectrometer was used for the analysis. Two signature peptides (Pep-1, and Pep-2) were employed to quantify UGT1A1 by multiple reaction monitoring (MRM) approach. Standard addition method was used to validate the assay to account for the matrix effect. 17β-Estradiol was used as the marker substrate to determine UGT1A1 activities. The validated method has a linear range of 200-0.0195nM for both signature peptides. The precision, accuracy, and matrix effect were in acceptable ranges. UGT1A1 expression levels were then determined using 8 individual human liver microsomes, a pooled human liver microsomes, three UGT1A1 genotyped human liver microsomes, and four cell lines (Caco-2, MCF-7, Hela, and HepG2). The correlations study showed that the UGT1A1 protein levels were strongly correlated with its glucuronidation activities in human liver microsomes (R(2)=0.85) and in microsomes prepared from cell lines (R(2)=0.95). Isotope-labeled peptides were not necessary for LC-MS/MS quantitation of proteins. The isotope label-free absolute quantification method used here had good accuracy, sensitivity, linear range, and reproducibility, and were used successfully for the accurate determination of UGT1A1 from tissues and cell lines.
Keywords: Absolute quantification; CE; CXP; CYP; DP; Glucuronidation; HLM; LC–MS/MS; LLOQ; MRM; Microsomes; PTM; RLM; UGT; UGT1A1; UPLC; collision cell exit potential; collision energy; cytochrome P450; declustering potential; human liver microsome; lower limit of quantification; multiple reaction monitoring; post translational modification; rat liver microsome; ultra performance liquid chromatography; uridine 5′-diphospho-glucuronosyltransferase (UDP-glucuronosyltransferase).
Copyright © 2013 Elsevier B.V. All rights reserved.
Figures


Similar articles
-
Significantly decreased and more variable expression of major CYPs and UGTs in liver microsomes prepared from HBV-positive human hepatocellular carcinoma and matched pericarcinomatous tissues determined using an isotope label-free UPLC-MS/MS method.Pharm Res. 2015 Mar;32(3):1141-57. doi: 10.1007/s11095-014-1525-x. Epub 2014 Oct 8. Pharm Res. 2015. PMID: 25288013 Free PMC article.
-
Protein quantification of UDP-glucuronosyltransferases 1A1 and 2B7 in human liver microsomes by LC-MS/MS and correlation with glucuronidation activities.Xenobiotica. 2012 Sep;42(9):823-9. doi: 10.3109/00498254.2012.665950. Epub 2012 Mar 21. Xenobiotica. 2012. PMID: 22435749
-
Absolute quantification of human uridine-diphosphate glucuronosyl transferase (UGT) enzyme isoforms 1A1 and 1A6 by tandem LC-MS.Drug Metab Lett. 2008 Aug;2(3):210-22. doi: 10.2174/187231208785425764. Drug Metab Lett. 2008. PMID: 19356096
-
Functional Interaction between Cytochrome P450 and UDP-Glucuronosyltransferase on the Endoplasmic Reticulum Membrane: One of Post-translational Factors Which Possibly Contributes to Their Inter-Individual Differences.Biol Pharm Bull. 2021;44(11):1635-1644. doi: 10.1248/bpb.b21-00286. Biol Pharm Bull. 2021. PMID: 34719641 Review.
-
Belinostat Therapy and UGT1A1 Genotype.2023 Jul 20. In: Pratt VM, Scott SA, Pirmohamed M, Esquivel B, Kattman BL, Malheiro AJ, editors. Medical Genetics Summaries [Internet]. Bethesda (MD): National Center for Biotechnology Information (US); 2012–. 2023 Jul 20. In: Pratt VM, Scott SA, Pirmohamed M, Esquivel B, Kattman BL, Malheiro AJ, editors. Medical Genetics Summaries [Internet]. Bethesda (MD): National Center for Biotechnology Information (US); 2012–. PMID: 37487012 Free Books & Documents. Review.
Cited by
-
Impact of Sample Matrix on Accuracy of Peptide Quantification: Assessment of Calibrator and Internal Standard Selection and Method Validation.Anal Chem. 2016 Jan 5;88(1):746-53. doi: 10.1021/acs.analchem.5b03004. Epub 2015 Dec 14. Anal Chem. 2016. PMID: 26606514 Free PMC article.
-
Comparative Proteomic Characterization of 4 Human Liver-Derived Single Cell Culture Models Reveals Significant Variation in the Capacity for Drug Disposition, Bioactivation, and Detoxication.Toxicol Sci. 2015 Oct;147(2):412-24. doi: 10.1093/toxsci/kfv136. Epub 2015 Jul 8. Toxicol Sci. 2015. PMID: 26160117 Free PMC article.
-
Comparison of Absolute Expression and Turnover Number of COX-1 and COX-2 in Human and Rodent Cells and Tissues.J Inflamm Res. 2022 Aug 4;15:4435-4447. doi: 10.2147/JIR.S365842. eCollection 2022. J Inflamm Res. 2022. PMID: 35958187 Free PMC article.
-
Identification and quantification of the molecular species of bilirubin BDG, BMG and UCB by LC‒MS/MS in hyperbilirubinemic human serum.PLoS One. 2024 Nov 19;19(11):e0313044. doi: 10.1371/journal.pone.0313044. eCollection 2024. PLoS One. 2024. PMID: 39561208 Free PMC article.
-
Significantly decreased and more variable expression of major CYPs and UGTs in liver microsomes prepared from HBV-positive human hepatocellular carcinoma and matched pericarcinomatous tissues determined using an isotope label-free UPLC-MS/MS method.Pharm Res. 2015 Mar;32(3):1141-57. doi: 10.1007/s11095-014-1525-x. Epub 2014 Oct 8. Pharm Res. 2015. PMID: 25288013 Free PMC article.
References
-
- Liu Y, Hu M. Absorption and metabolism of flavonoids in the caco-2 cell culture model and a perused rat intestinal model. Drug Metab Dispos. 2002;30:370–377. - PubMed
-
- Takahashi M, Hirano A, Oishi Y, Sato M, Yoshino M, Ikemura K, Shibata M, Fukushima N, Amioka K, Nomura T, Yokomaku Y, Sugiura W. Lack of correlation between UGT1A1*6, *28 genotypes, and plasma raltegravir concentrations in Japanese HIV-1-infected patients. J Int AIDS Soc. 2012;15:18342. - PubMed
MeSH terms
Substances
Grants and funding
LinkOut - more resources
Full Text Sources
Other Literature Sources
Miscellaneous
