

Paclitaxel-loaded polymeric microparticles: quantitative relationships between in vitro drug release rate and in vivo pharmacodynamics
- PMID: 24056144
- PMCID: PMC3881265
- DOI: 10.1016/j.jconrel.2013.09.011
Paclitaxel-loaded polymeric microparticles: quantitative relationships between in vitro drug release rate and in vivo pharmacodynamics
Abstract
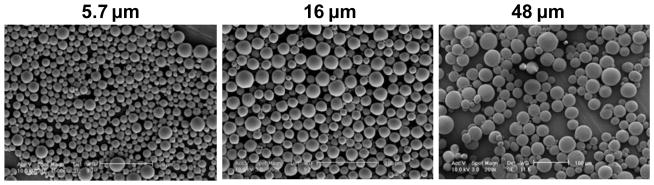
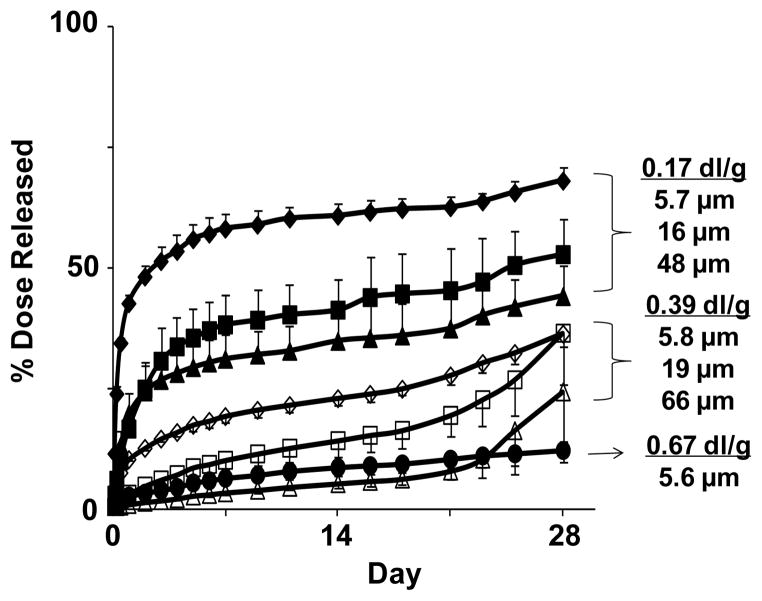
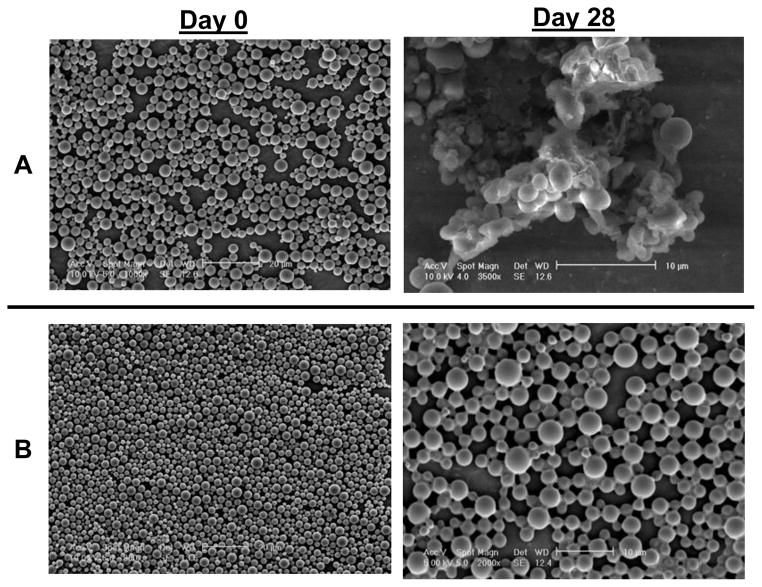
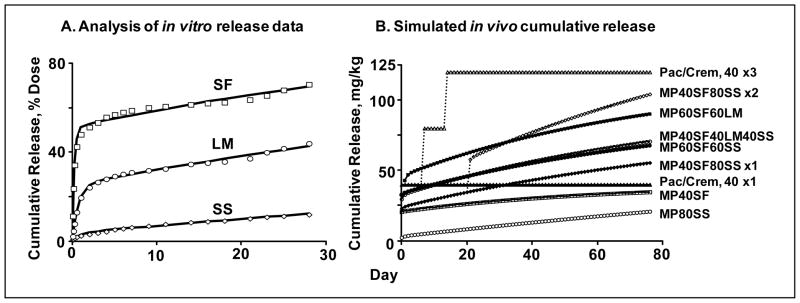
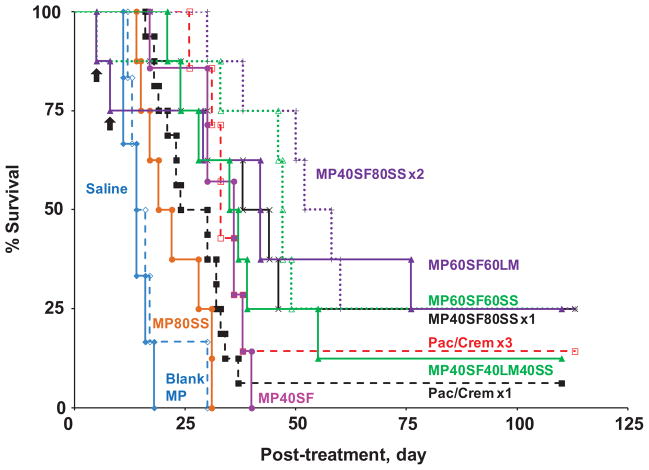
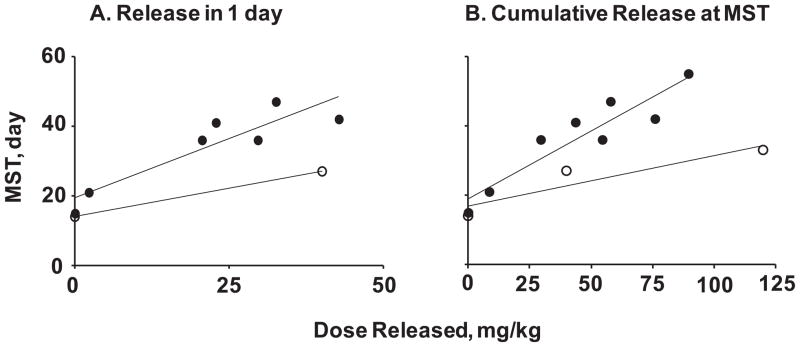
Intraperitoneal therapy (IP) has demonstrated survival advantages in patients with peritoneal cancers, but has not become a widely practiced standard-of-care in part due to local toxicity and sub-optimal drug delivery. Paclitaxel-loaded, polymeric microparticles were developed to overcome these limitations. The present study evaluated the effects of microparticle properties on paclitaxel release (extent and rate) and in vivo pharmacodynamics. In vitro paclitaxel release from microparticles with varying physical characteristics (i.e., particle size, copolymer viscosity and composition) was evaluated. A method was developed to simulate the dosing rate and cumulative dose released in the peritoneal cavity based on the in vitro release data. The relationship between the simulated drug delivery and treatment outcomes of seven microparticle compositions was studied in mice bearing IP human pancreatic tumors, and compared to that of the intravenous Cremophor micellar paclitaxel solution used off-label in previous IP studies. Paclitaxel release from polymeric microparticles in vitro was multi-phasic; release was greater and more rapid from microparticles with lower polymer viscosities and smaller diameters (e.g., viscosity of 0.17 vs. 0.67 dl/g and diameter of 5-6 vs. 50-60 μm). The simulated drug release in the peritoneal cavity linearly correlated with treatment efficacy in mice (r(2)>0.8, p<0.001). The smaller microparticles, which distribute more evenly in the peritoneal cavity compared to the large microparticles, showed greater dose efficiency. For single treatment, the microparticles demonstrated up to 2-times longer survival extension and 4-times higher dose efficiency, relative to the paclitaxel/Cremophor micellar solution. Upon repeated dosing, the paclitaxel/Cremophor micellar solution showed cumulative toxicity whereas the microparticle that yielded 2-times longer survival did not display cumulative toxicity. The efficacy of IP therapy depended on both temporal and spatial factors that were determined by the characteristics of the drug delivery system. A combination of fast- and slow-releasing microparticles with 5-6 μm diameter provided favorable spatial distribution and optimal drug release for IP therapy.
Keywords: AIC; Akaike Information Criterion; Controlled release; GA; HPLC; ILS; IP; In vitro–in vivo correlation; Intraperitoneal therapy; LA; LM; MP; MST; PLGA; PLGA microparticles; Paclitaxel; SF; SS; Tg; VIS; glass transition temperature; glycolic acid; high performance liquid chromatograph; increase in life span; inherent viscosity; intraperitoneal; lactic acid; large microparticles with medium release rate; median survival time; microparticles; poly(d,l-lactide-co-glycolide) acid; small microparticles with fast release rate; small microparticles with slow release rate.
© 2013.
Figures
Comment in
-
In vitro and in vivo correlation of paclitaxel-loaded polymeric microparticles.J Control Release. 2013 Dec 28;172(3):1162. doi: 10.1016/j.jconrel.2013.11.015. J Control Release. 2013. PMID: 24315459 No abstract available.
Similar articles
-
Versatility of Particulate Carriers: Development of Pharmacodynamically Optimized Drug-Loaded Microparticles for Treatment of Peritoneal Cancer.AAPS J. 2015 Sep;17(5):1065-79. doi: 10.1208/s12248-015-9785-x. Epub 2015 Jun 19. AAPS J. 2015. PMID: 26089090 Free PMC article. Review.
-
In vitro and in vivo correlation of paclitaxel-loaded polymeric microparticles.J Control Release. 2013 Dec 28;172(3):1162. doi: 10.1016/j.jconrel.2013.11.015. J Control Release. 2013. PMID: 24315459 No abstract available.
-
Delivery of doxorubicin and paclitaxel from double-layered microparticles: The effects of layer thickness and dual-drug vs. single-drug loading.Acta Biomater. 2015 Nov;27:53-65. doi: 10.1016/j.actbio.2015.08.051. Epub 2015 Sep 1. Acta Biomater. 2015. PMID: 26340886
-
Microparticles produced by the hydrogel template method for sustained drug delivery.Int J Pharm. 2014 Jan 30;461(1-2):258-69. doi: 10.1016/j.ijpharm.2013.11.058. Epub 2013 Dec 11. Int J Pharm. 2014. PMID: 24333903 Free PMC article.
-
Interfacial tension effects on the properties of PLGA microparticles.Colloids Surf B Biointerfaces. 2020 Dec;196:111300. doi: 10.1016/j.colsurfb.2020.111300. Epub 2020 Aug 23. Colloids Surf B Biointerfaces. 2020. PMID: 32919245 Free PMC article. Review.
Cited by
-
Versatility of Particulate Carriers: Development of Pharmacodynamically Optimized Drug-Loaded Microparticles for Treatment of Peritoneal Cancer.AAPS J. 2015 Sep;17(5):1065-79. doi: 10.1208/s12248-015-9785-x. Epub 2015 Jun 19. AAPS J. 2015. PMID: 26089090 Free PMC article. Review.
-
Advancing drug delivery systems for the treatment of multiple sclerosis.Immunol Res. 2015 Dec;63(1-3):58-69. doi: 10.1007/s12026-015-8719-0. Immunol Res. 2015. PMID: 26475738 Review.
-
Intraperitoneal drug delivery systems releasing cytostatic agents to target gastro-intestinal peritoneal metastases in laboratory animals: a systematic review.Clin Exp Metastasis. 2022 Aug;39(4):541-579. doi: 10.1007/s10585-022-10173-8. Epub 2022 Jun 23. Clin Exp Metastasis. 2022. PMID: 35737252 Free PMC article.
-
Inducing G2/M Cell Cycle Arrest and Apoptosis through Generation Reactive Oxygen Species (ROS)-Mediated Mitochondria Pathway in HT-29 Cells by Dentatin (DEN) and Dentatin Incorporated in Hydroxypropyl-β-Cyclodextrin (DEN-HPβCD).Int J Mol Sci. 2016 Oct 18;17(10):1653. doi: 10.3390/ijms17101653. Int J Mol Sci. 2016. PMID: 27763535 Free PMC article.
-
Synthesis, Structural Characterization, and Preclinical Efficacy of a Novel Paclitaxel-Loaded Alginate Nanoparticle for Breast Cancer Treatment.Int J Breast Cancer. 2016;2016:7549372. doi: 10.1155/2016/7549372. Epub 2016 Aug 30. Int J Breast Cancer. 2016. PMID: 27660726 Free PMC article.
References
-
- Cancer facts and figures. American Cancer Society; 2013.
-
- Zimm S, Cleary SM, Lucas WE, Weiss RJ, Markman M, Andrews PA, Schiefer MA, Kim S, Horton C, Howell SB. Phase I/pharmacokinetic study of intraperitoneal cisplatin and etoposide. Cancer Res. 1987;47:1712–1716. - PubMed
-
- Nagel JD, Varossieau FJ, Dubbelman R, Bokkel Huinink WW, McVie JG. Clinical pharmacokinetics of mitoxantrone after intraperitoneal administration. Cancer Chemother Pharmacol. 1992;29:480–484. - PubMed
-
- Kerr DJ, Los G. Pharmacokinetic principles of locoregional chemotherapy. Cancer Surv. 1993;17:105–122. - PubMed
Publication types
MeSH terms
Substances
Grants and funding
LinkOut - more resources
Full Text Sources
Other Literature Sources
Medical
Miscellaneous
