. 2013 Oct;15(10):1164-75.
doi: 10.1038/ncb2843. Epub 2013 Sep 22.

In vivo reprogramming of astrocytes to neuroblasts in the adult brain

Affiliations

In vivo reprogramming of astrocytes to neuroblasts in the adult brain

Wenze Niu et al. Nat Cell Biol. 2013 Oct.

Abstract

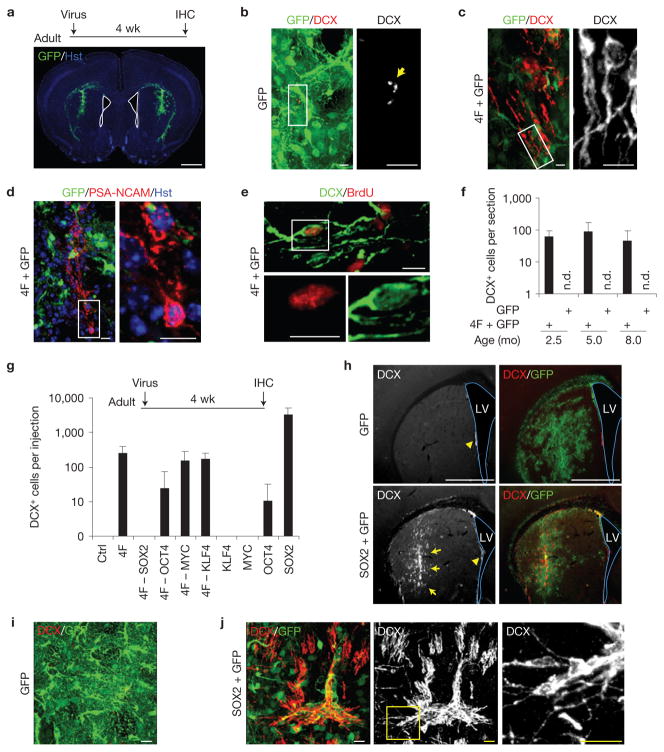
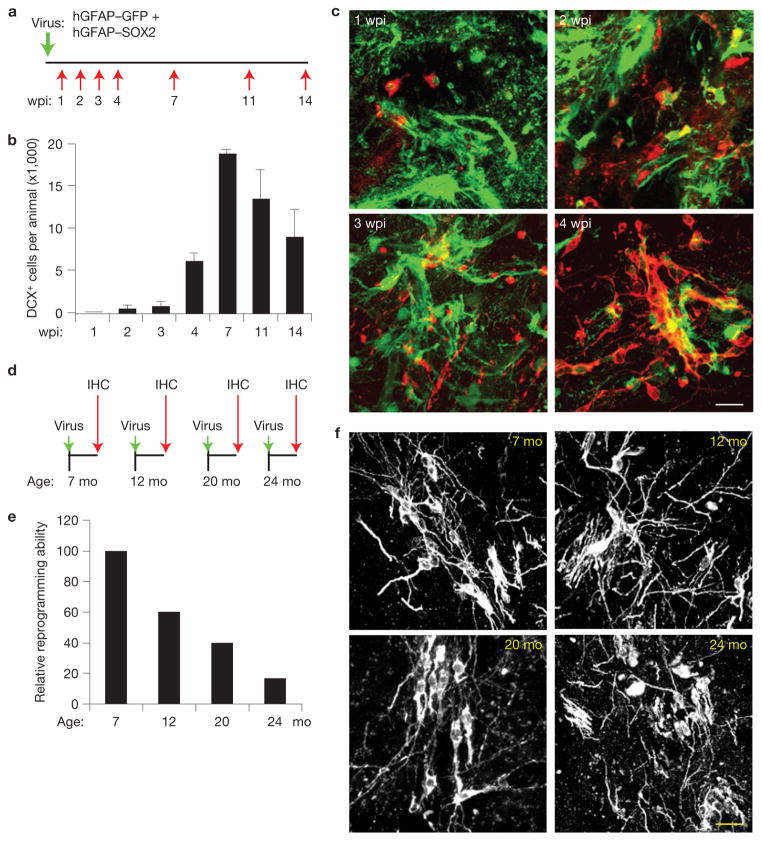
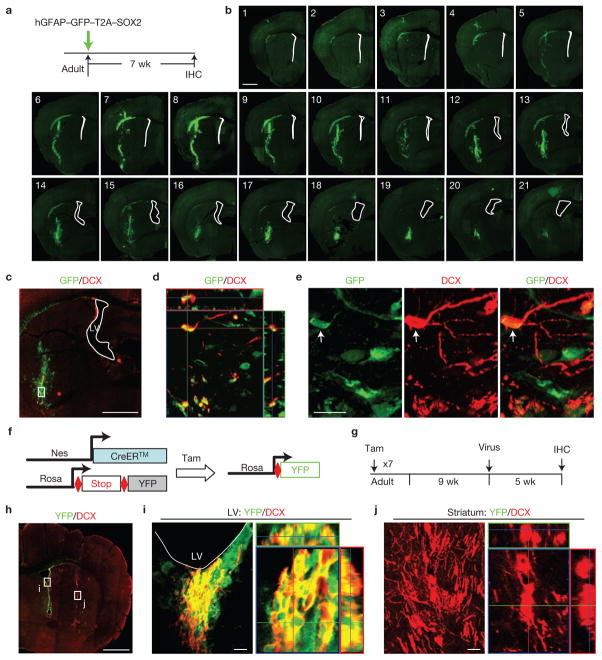
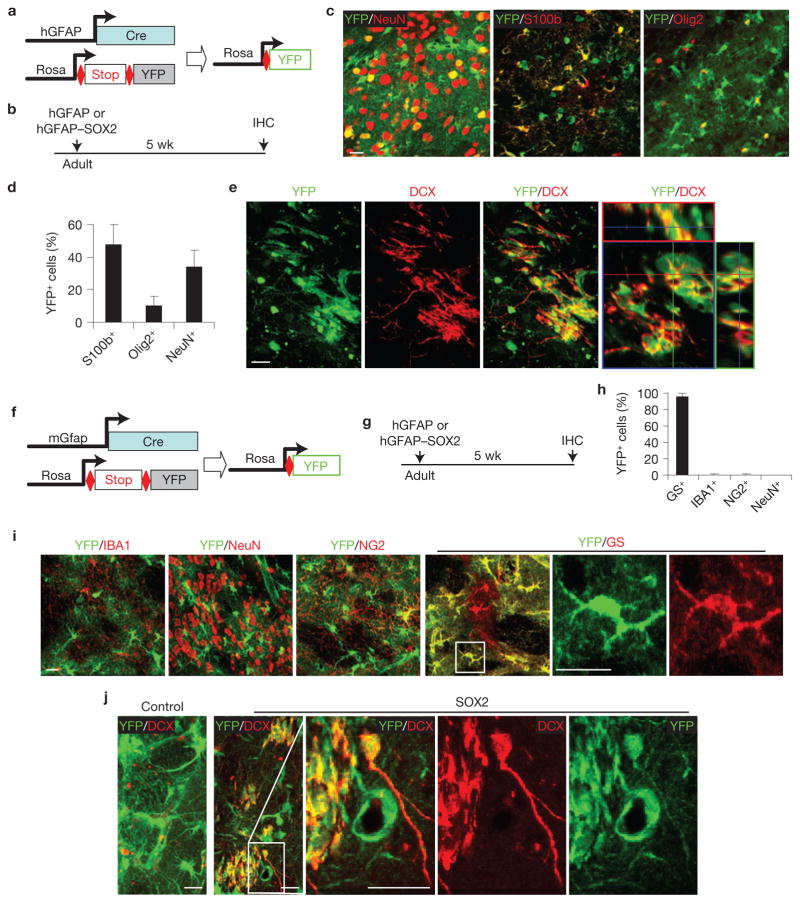
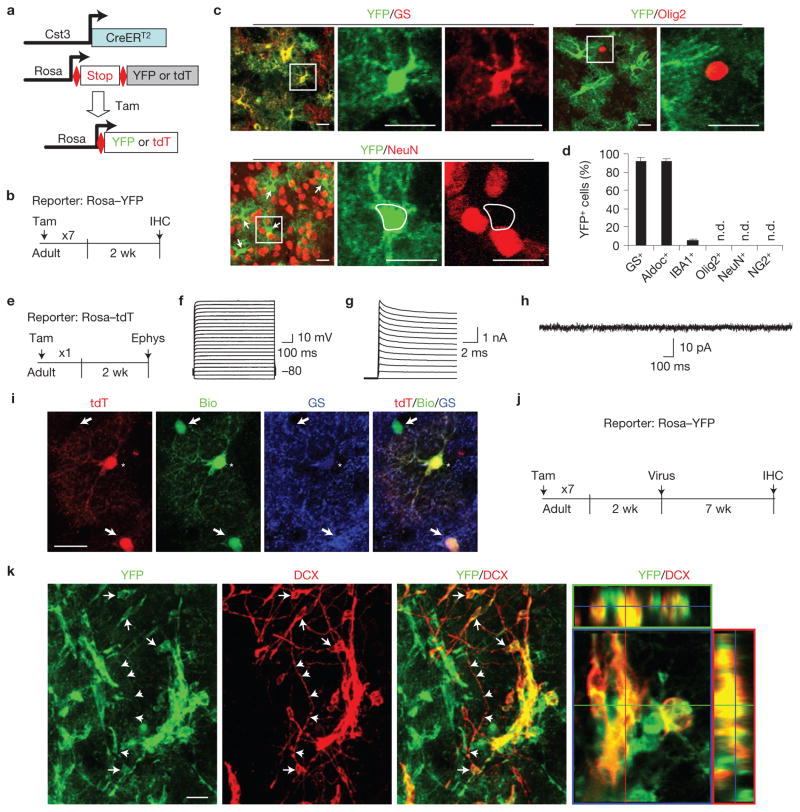
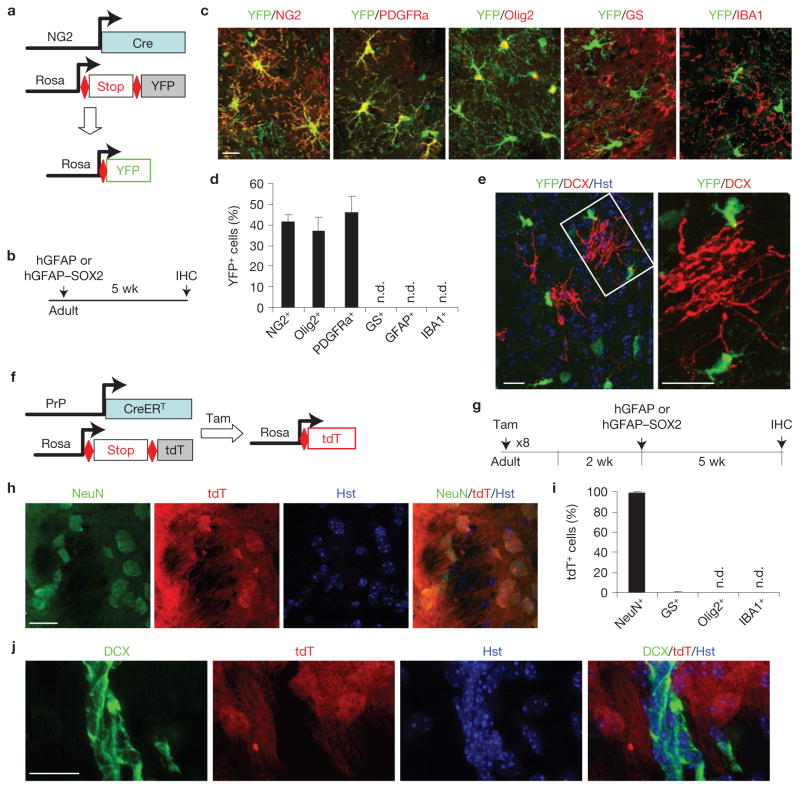
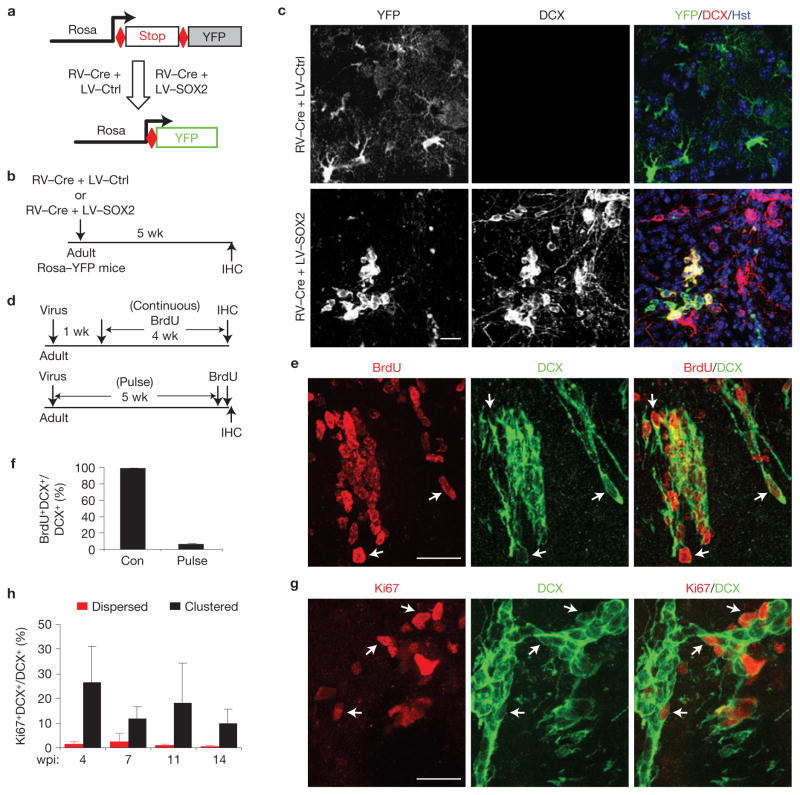
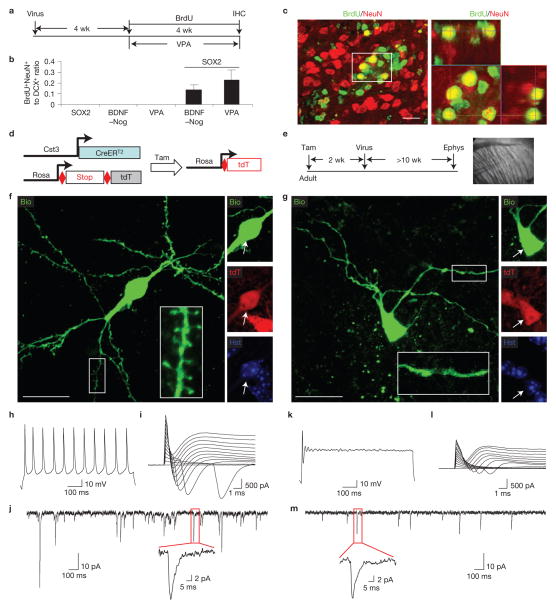
Adult differentiated cells can be reprogrammed into pluripotent stem cells or lineage-restricted proliferating precursors in culture; however, this has not been demonstrated in vivo. Here, we show that the single transcription factor SOX2 is sufficient to reprogram resident astrocytes into proliferative neuroblasts in the adult mouse brain. These induced adult neuroblasts (iANBs) persist for months and can be generated even in aged brains. When supplied with BDNF and noggin or when the mice are treated with a histone deacetylase inhibitor, iANBs develop into electrophysiologically mature neurons, which functionally integrate into the local neural network. Our results demonstrate that adult astrocytes exhibit remarkable plasticity in vivo, a feature that might have important implications in regeneration of the central nervous system using endogenous patient-specific glial cells.


Conflict of interest statement

COMPETING FINANCIAL INTERESTS

The authors declare no competing financial interests.

Figures

Figure 1
Figure 1
Inducing de novo neurogenesis in adult mouse brains. (a) Screening strategy. GFP expression indicates virus-infected striatal regions. Nuclei were counterstained with Hoechst 33342 (Hst). The lateral ventricle is outlined. IHC, immunohistochemistry; wk, weeks. (b,c) Representative images showing DCX+ cells in 4F-injected but not in control GFP-injected brains. Nonspecific stains in control brains are indicated by an arrow. (d) PSA-NCAM expression in 4F-injected brain regions. Higher-magnification views of the outlined areas are shown in the right panels (bd). (e) BrdU-labelling shows that DCX+ cells in 4F-injected areas were newly generated. The bottom panels are higher-magnification views of the outlined area. (f) A pool of 4 factors (4F) was sufficient to induce DCX+ cells in adult mouse brains across three tested age groups, whereas the GFP control had no effect. n.d., not detected; mo, months. Data are presented as mean ± s.d., n = 3, 9 and 5 injections at the age of 2.5, 5 and 8 months, respectively. (g) Screens to identify the key factor(s) within the 4F pool. Total DCX+ cells were counted within the injected striatal regions. Data are presented as mean ± s.d., n = 8 injections for GFP (Ctrl) and 4F, n = 6 injections for 4F– MYC, and n = 4 injections for the remaining experimental groups. (h) Low-magnification views of the injected brain regions showing overall expression of GFP and DCX. Arrows show regions with massive SOX2-induced DCX+ cells, whereas arrowheads indicate endogenous DCX+ cells near the lateral ventricle (LV). Co-injected GFP shows virus-infected regions. (i) A representative image from control GFP virus-injected brain regions. DCX+ cells were not detected. (j) Confocal images showing DCX+ cells induced by SOX2. The right panel is a higher-magnification view of the outlined area. Scale bars: 1 mm (a,h), 20 μm (i, j) and 10 μm (be).
Figure 2
Figure 2
Progressive generation of iANBs. (a) Experimental design to examine the time course of iANB generation. Lentivirus was injected into the adult striatum and analysed at the indicated time points. wpi, weeks post injection. (b) Quantification of induced DCX+ cells. Data are presented as mean ± s.d., n = 3 animals at 7 wpi, and n = 4 animals for the rest of time points. (c) Immunofluorescence staining of DCX+ cells in virus-injected regions at the indicated wpi. (d) Experimental design to examine the effect of age on iANBs. Mice at the indicated ages were injected with SOX2 lentivirus and analysed at 5 wpi. (e) The number of SOX2-induced DCX+ cells was quantified and normalized to 7-month-old mice. n = 4 animals at 7 mo, n = 5 animals at 12 and 20 mo, and n = 6 animals at 24 mo. (f) Morphology of induced DCX+ cells in virus-injected striatal regions at the indicated ages. Scale bars: 20 μm.
Figure 3
Figure 3
iANBs are locally produced within the adult mouse striatum. (a) Experimental design. Infected cells are marked by co-expressed GFP. (b) Serial coronal brain sections spanning the virus-injected regions show that cells within the lateral ventricle (marked by white lines) were not infected by lentivirus. (c) A lower-magnification view of virus-infected cells significantly away from the lateral ventricle (LV). Higher-magnification views of the cells in the region outlined by the rectangle are shown in d,e. (d) An orthogonal view of induced DCX+ cells that co-express GFP, indicating that they are derived from virus-infected cells. (e) Higher-magnification views of cells in the region outlined by the rectangle in c. (f,g) A genetic strategy to trace NSCs and their progenies within the adult neurogenic niches. Tam, tamoxifen. (h) Lower-magnification views of YFP and DCX expression in lineage-traced and SOX2-virus-injected Nes–CreERTM;Rosa–YFP mice. (i) Confocal analysis showing DCX+ cells within the lateral ventricle (the outlined region i in h) are traced with YFP. (j) SOX2-induced DCX+ cells within the injected striatal area (the outlined region j in h) are YFP, indicating that they are locally produced rather than migrating from the endogenous neurogenic niches. Scale bars: 1 mm (b,c,h) and 20 μm (e,i,j).
Figure 4
Figure 4
iANBs originate from cells traced by hGFAP–Cre or mGfap–Cre line 77.6. (a) A genetic approach to trace glial cell lineage using hGFAP–Cre;Rosa-YFP mice. (b) Experimental design. (c,d) hGFAP–Cre traces astrocytes (S100b+), neurons (NeuN+) and some oligodendrocytes (Olig2+). Data are presented as mean ± s.d. Mean is shown for n = 3 animals, scoring for each animal 280 or more YFP+ cells from 3 to 6 brain sections for each marker. (e) Immunofluorescence analysis showing that nearly all DCX+ cells are also YFP+ in striatal regions injected with SOX2 virus. (f) A genetic approach to trace glial cell lineage using mGfap–Cre line 77.6;Rosa–YFP mice. (g) Experimental design. (h,i) Most cells traced by mGfap–Cre line 77.6 are astrocytes (GS+) and not other cell types. Data are presented as mean ± s.d. Mean is shown for n = 3 animals, scoring for each animal 300 or more YFP+ cells from 3 to 6 brain sections for each marker. (j) Immunofluorescence analysis showing nearly all DCX+ cells are also labelled by YFP in striatal regions injected with SOX2 virus. Higher-magnification views of the outlined areas are shown in the right panels (i,j). Scale bars, 20 μm.
Figure 5
Figure 5
iANBs originate from astrocytes. (a,b) A genetic strategy to trace astrocytes and their derivatives. (c,d) Immunohistochemistry analyses showing that most YFP-traced cells in the adult striatum are astrocytes (GS+ or Aldoc+). Higher-magnification views of the outlined areas are shown in the right panels. n.d., not detected. Arrows show NeuNYFP+ cells. Data are presented as mean ± s.d. Mean is shown for n = 3 animals, scoring for each animal 250 or more YFP+ cells from 3 to 6 brain sections for each marker. (e) An experimental scheme to analyse the electrophysiological properties of Cst3–CreERT2-traced cells. Ephys, electrophysiology. (f) Voltage responses of a tdT+ cell to current steps from −160 pA with +160 pA intervals. (g) Current responses of the same tdT+ cell to voltage steps from −60 mV with +10 mV intervals. (h) Current recordings from the same tdT+ cell clamped at −80 mV with no stimulation. (i) The recorded tdT+ cell (indicated by an asterisk) was loaded with biocytin (bio). Neighbouring GS+ astrocytes (indicated by arrows) were also bio-labelled as a result of gap junction coupling between astrocytes. (j,k) SOX2-induced DCX+ cells in the striatum are labelled by YFP in Cst3–CreERT2;Rosa–YFP mice, indicating an origin of astrocytes. Arrows and arrowheads respectively show cell bodies and processes that are positive for both YFP and DCX. Scale bars, 20 μm.
Figure 6
Figure 6
Neither NG2-glia nor neurons contribute to iANBs. (a) A genetic approach to trace NG2-glia lineage. (b) Experimental design. (c,d) NG2-Cre-traced cells are NG2 cells, oligodendrocytes or their precursors, but not astrocytes or microglia. n.d., not detected. Data are presented as mean ± s.d. Mean is shown for n = 3 animals, scoring for each animal 250 or more YFP+ cells from 3 to 6 brain sections for each marker. (e) Immunofluorescence analysis showing none of the induced DCX+ cells is labelled by YFP in striatal regions injected with SOX2 virus. A higher-magnification view of the outlined area is shown in the right panel. (f,g) A genetic approach to trace neurons and their derivatives. (h,i) Neurons are permanently labelled by tamoxifen induced expression of tdT in PrPCreERT;Rosa–tdT mice. Data are presented as mean ± s.d. Mean is shown for n = 3 animals, scoring for each animal 300 or more tdT+ cells from 3 to 6 brain sections for each marker. (j) SOX2-induced iANBs in the striatum are not labelled by tdT, indicating a non-neuronal origin. Scale bars, 20 μm.
Figure 7
Figure 7
iANBs pass through a proliferative state. (ac) iANBs are largely derived from quiescent glial cells at the time of viral infection. (a,b) Experimental design. Proliferating cells at the time of viral infection were labelled by retrovirus-expressed Cre (RV–Cre) in Rosa–YFP mice. iANBs were induced by lentivirus-expressed SOX2 (LV-SOX2). An empty lentivirus was used as a control (LV-Ctrl). (c) Immunofluorescence analysis of DCX+ and YFP+ cells in striatal regions. Only 0.9% of DCX+ cells in SOX2 virus-infected striatal regions are also labelled by YFP. Those rare DCX+YFP+ cells are shown. (df) Proliferating iANBs were labelled by either continuous (Con) BrdU-treatment in drinking water for 4 weeks or by 2 pulses of BrdU injections before euthanization. Cells within the virus-injected striatal regions are shown. Arrows indicate co-labelled cells. Data are presented as mean ± s.d., n = 3 and 4 animals for pulse and continuous BrdU-labelling, respectively. (g,h) Ki67+ cells within clustered or dispersed DCX+ cells. Arrows indicate co-labelled cells. Data are presented as mean ± s.d. For dispersed cells, n = 8, 4, 4 and 3 animals analysed at 4, 7, 11 and 14 wpi, respectively; for clustered cells, n = 6, 4, 3 and 3 animals analysed at 4, 7, 11 and 14 wpi, respectively. Scale bars, 20 μm.
Figure 8
Figure 8
iANBs develop into functionally mature neurons. (a) Experimental design. Adult mice were injected with lentivirus and treated with BrdU for the indicated time period. A separate cohort of mice injected with SOX2 or a control virus was also simultaneously treated with VPA for 4 weeks. (b) Quantification of BrdU+NeuN+ and DCX+ cells in lentivirus-injected regions. Data are presented as mean ± s.d.; n = 3 and 4 animals for SOX2 + BDNF–Nog and SOX2 + VPA, respectively; n = 5 animals for the remaining groups. (c) Immunofluorescence analysis showing BrdU+NeuN+ cells in regions injected with lentivirus expressing SOX2 and BDNF–Nog. An orthogonal view of the cells in the outlined region is shown in the right panel. (d,e) Experimental design to analyse the electrophysiological properties of SOX2-induced neurons in the adult striatum. Ephys, electrophysiology. (f,g) Confocal images of recorded tdT+ cells (indicated by arrows), which were also loaded with biocytin (Bio) during recording. Enlarged views of the outlined regions show detailed dendritic morphology of the recorded cells. (hj) Electrophysiology of a spiny tdT+ cell labelled in panel f. This cell fired repetitive action potentials in response to depolarization (h), exhibited inward currents in response to step voltages (i), and showed spontaneous synaptic currents when voltage clamped at the resting membrane potential (j). (km) Electrophysiological recordings from an aspiny tdT+ cell labelled in panel g. This cell fired a single action potential (k), showed smaller inward currents (l), and less frequent spontaneous synaptic currents with smaller amplitude (m). Scale bars, 20 μm.

Comment in

  • Glia: Reprogramming the residents.
    Yates D. Yates D. Nat Rev Neurosci. 2013 Nov;14(11):739. doi: 10.1038/nrn3620. Epub 2013 Oct 9. Nat Rev Neurosci. 2013. PMID: 24105344 No abstract available.

References

    1. Zhao C, Deng W, Gage FH. Mechanisms and functional implications of adult neurogenesis. Cell. 2008;132:645–660. - PubMed
    1. Kriegstein A, Alvarez-Buylla A. The glial nature of embryonic and adult neural stem cells. Annu Rev Neurosci. 2009;32:149–184. - PMC - PubMed
    1. Ma DK, Bonaguidi MA, Ming GL, Song H. Adult neural stem cells in the mammalian central nervous system. Cell Res. 2009;19:672–682. - PMC - PubMed
    1. Hsieh J. Orchestrating transcriptional control of adult neurogenesis. Genes Dev. 2012;26:1010–1021. - PMC - PubMed
    1. Kempermann G, Jessberger S, Steiner B, Kronenberg G. Milestones of neuronal development in the adult hippocampus. Trends Neurosci. 2004;27:447–452. - PubMed

Publication types

Substances