. 2013 Dec;195(4):1407-17.
doi: 10.1534/genetics.113.152256. Epub 2013 Sep 20.

Integration of new genes into cellular networks, and their structural maturation

Affiliations

Integration of new genes into cellular networks, and their structural maturation

György Abrusán. Genetics. 2013 Dec.

Abstract

It has been recently discovered that new genes can originate de novo from noncoding DNA, and several biological traits including expression or sequence composition form a continuum from noncoding sequences to conserved genes. In this article, using yeast genes I test whether the integration of new genes into cellular networks and their structural maturation shows such a continuum by analyzing their changes with gene age. I show that 1) The number of regulatory, protein-protein, and genetic interactions increases continuously with gene age, although with very different rates. New regulatory interactions emerge rapidly within a few million years, while the number of protein-protein and genetic interactions increases slowly, with a rate of 2-2.25 × 10(-8)/year and 4.8 × 10(-8)/year, respectively. 2) Gene essentiality evolves relatively quickly: the youngest essential genes appear in proto-genes ∼14 MY old. 3) In contrast to interactions, the secondary structure of proteins and their robustness to mutations indicate that new genes face a bottleneck in their evolution: proto-genes are characterized by high β-strand content, high aggregation propensity, and low robustness against mutations, while conserved genes are characterized by lower strand content and higher stability, most likely due to the higher probability of gene loss among young genes and accumulation of neutral mutations.

Keywords: Saccharomyces cerevisiae; aggregation; de novo genes; protein–protein interaction; regulatory network; secondary structure.


Figures
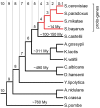
Figure 1
Figure 1
A schematic phylogenetic tree of fungal species and conservation of yeast genes (modified from Carvunis et al. 2012). The main bifurcation events on the Saccharomyces lineage are numbered, from 0 to 10, and age estimates were obtained using TimeTree (Hedges et al. 2006), except for S. castellii, which split from the Saccharomyces lineage 100–150 MYA, after the whole-genome duplication of yeasts (Cliften et al. 2006). Yeast genes were classified according to their conservation level, which corresponds to the phylogenetic spread of their orthologs; for example, a yeast gene with conservation level 5 means that it has orthologs in S. castellii but not in the fungal species that split earlier from the Saccharomyces lineage, while conservation level 7 means that the yeast gene has orthologs either in Debaryomyces hansenii or C. albicans. Conservation level 0 marks the putative ORFs identified by Carvunis et al. (2012), excluding sequences shorter than 50 aa, while conservation level 1 indicates genes annotated by the Saccharomyces Genome Consortium, having no orthologs in any other species.
Figure 2
Figure 2
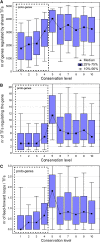
Integration of new genes into regulatory networks. Proto-genes acquire regulatory interactions rapidly; already genes with conservation level 1 are co-regulated with thousands of genes (A), (B) are regulated by several transcription factors (B), and also rapidly gain regulatory motifs (feed-forward loops) (C). The difference between proto-genes and conserved genes largely disappears by conservation level 4, representing ∼14 million-year-old genes (P > 0.05 for conservation levels 5,6,8,10, ANOVA, Bonferroni post hoc tests).
Figure 3
Figure 3
The percentage of essential genes among genes with different conservation level; proportions are indicated above the bars. The youngest essential genes that do not overlap with older genes (YEL035C, YPL124W) appear in conservation level 4. (Note that among proto-genes that overlap with conserved genes, essentiality is present already in conservation level 1; however, in these cases their fitness effect is not independent from the overlapping conserved gene.)
Figure 4
Figure 4
Changes in secondary structure and aggregation propensity with gene age. While the amount of α-helices does not depend on protein age (A), the amount of β-strands declines significantly between conservation levels 4 and 6 (B). Aggregation propensity, which is partly caused by the presence of β-strands, shows an even stronger trend than β-strands, with random amino acid sequences and proto-genes being much more prone to aggregation than conserved genes (C).
Figure 5
Figure 5
The probability of gene loss in S. paradoxus or S. mikatae. Only proteins that emerged before the S. cerevisiaeS. mikatae split were examined. Genes with conservation levels 4–5 are lost at significantly higher frequencies than are more conserved genes (P < 0.05 for all comparisons between conservation levels 4–5 vs. 6–10, χ-square tests).
Figure 6
Figure 6
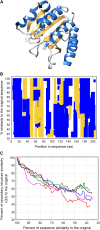
An overview of the analysis of protein structural robustness, on the example of yeast ORF YDR103W. (A) The tertiary structure of the protein (PDB id: 4F2H). α-helices are highlighted with blue and β-strands with yellow. (B) The sequence of the protein was gradually mutated in 70 steps; in each step 1% of the residues was changed, and in each step the secondary structure was determined. The change in the location of helices and sheets that occurs with the mutagenesis is indicted with the respective colors. As sequence similarity to the original sequence declines, fewer and fewer residues are part of the same secondary structure as in the original protein, particularly in β-strands. (C) For every protein the mutagenesis was repeated five times, and the Q3 value—the percentage of residues with the same secondary structure as in the original structure—was calculated for each step. Every line represents one mutagenesis path (replicate); in the analyses the average of the five replicates were used.
Figure 7
Figure 7
Structural robustness of proteins. (A) The robustness of secondary structures for mutations depends on their conservation level. Proto-genes and ancient genes show a highly significant difference (ANCOVA, P << 0.001 for comparisons between proto-genes and conserved genes, Bonferroni post hoc tests; whiskers represent 95% confidence intervals); the secondary structure of ancient genes is less sensitive for mutations (i.e., the Q3 value is higher). (B) β-strands decay faster from random mutations than α-helices (P << 0.001, ANCOVA). (C) The amount of β-strands in proteins correlates negatively with the structural stability of the protein. Q3 values were calculated at 50% sequence similarity with the original sequence. (D) The structural stability of proteins, excluding the regions with β-strands. The difference between proto-genes and ancient genes is still highly significant (P << 0.001, ANCOVA), indicating that it is not merely a by-product of compositional differences between ancient and proto-genes (see Figure 4).
Figure 8
Figure 8
The dependence of protein–protein and genetic interactions from gene age. Note that the y-axis is logarithmic and that only those genes were included that have interactions, to correct for research biases. (A) The number of protein–protein interactions increases continuously with conservation level; new protein–protein interactions emerge at a rate 2–2.25 × 10⁻⁸/year. (B) The number of genetic interactions increases at a rate of ∼4.8 × 10⁻⁸; however, the rate of change slows down above conservation level 6.
Figure 9
Figure 9
Genetic interactions of proto-genes show weaker epistasis than of conserved genes (P << 0.001, Mann–Whitney U-test). For each proto- and conserved gene the mean of their absolute genetic interaction scores (|ε|) were calculated; thus the histograms represent both the positive and negative epistatic interactions.

Similar articles

Cited by

References

    1. Abdulrehman D., Monteiro P. T., Teixeira M. C., Mira N. P., Lourenço A. B., et al. , 2011. YEASTRACT: providing a programmatic access to curated transcriptional regulatory associations in Saccharomyces cerevisiae through a web services interface. Nucleic Acids Res. 39: D136–D140. - PMC - PubMed
    1. Begun D. J., Lindfors H. A., Kern A. D., Jones C. D., 2007. Evidence for de novo evolution of testis-expressed genes in the Drosophila yakuba/Drosophila erecta clade. Genetics 176: 1131–1137. - PMC - PubMed
    1. Bershtein S., Goldin K., Tawfik D. S., 2008. Intense neutral drifts yield robust and evolvable consensus proteins. J. Mol. Biol. 379: 1029–1044. - PubMed
    1. Biegert A., Söding J., 2009. Sequence context-specific profiles for homology searching. Proc. Natl. Acad. Sci. USA 106: 3770–3775. - PMC - PubMed
    1. Bloom J. D., Drummond D. A., Arnold F. H., Wilke C. O., 2006a Structural determinants of the rate of protein evolution in yeast. Mol. Biol. Evol. 23: 1751–1761. - PubMed

Publication types

Substances

LinkOut - more resources