. 2013 Nov;16(11):1637-43.
doi: 10.1038/nn.3522. Epub 2013 Sep 22.

Optogenetic identification of a rapid eye movement sleep modulatory circuit in the hypothalamus

Affiliations

Optogenetic identification of a rapid eye movement sleep modulatory circuit in the hypothalamus

Sonia Jego et al. Nat Neurosci. 2013 Nov.

Abstract

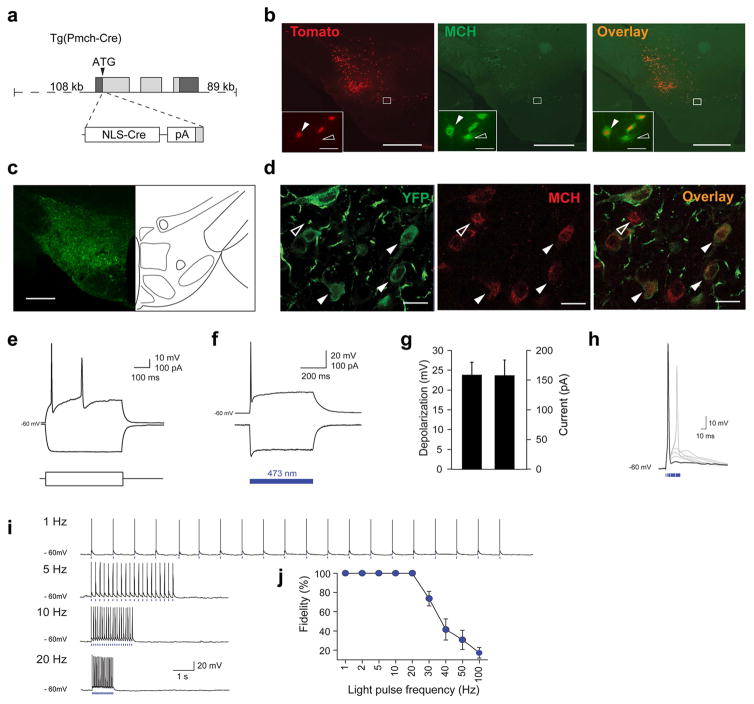
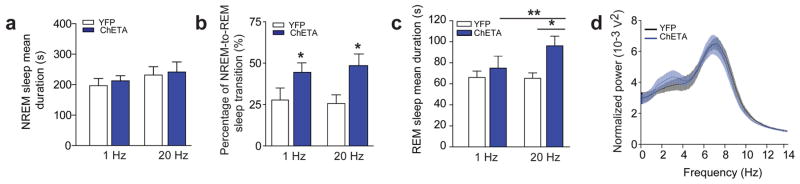
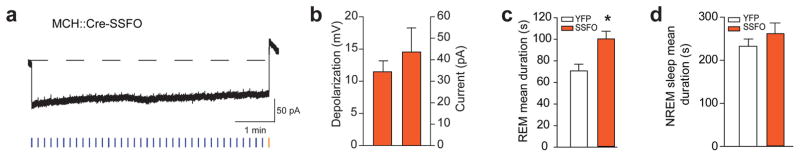
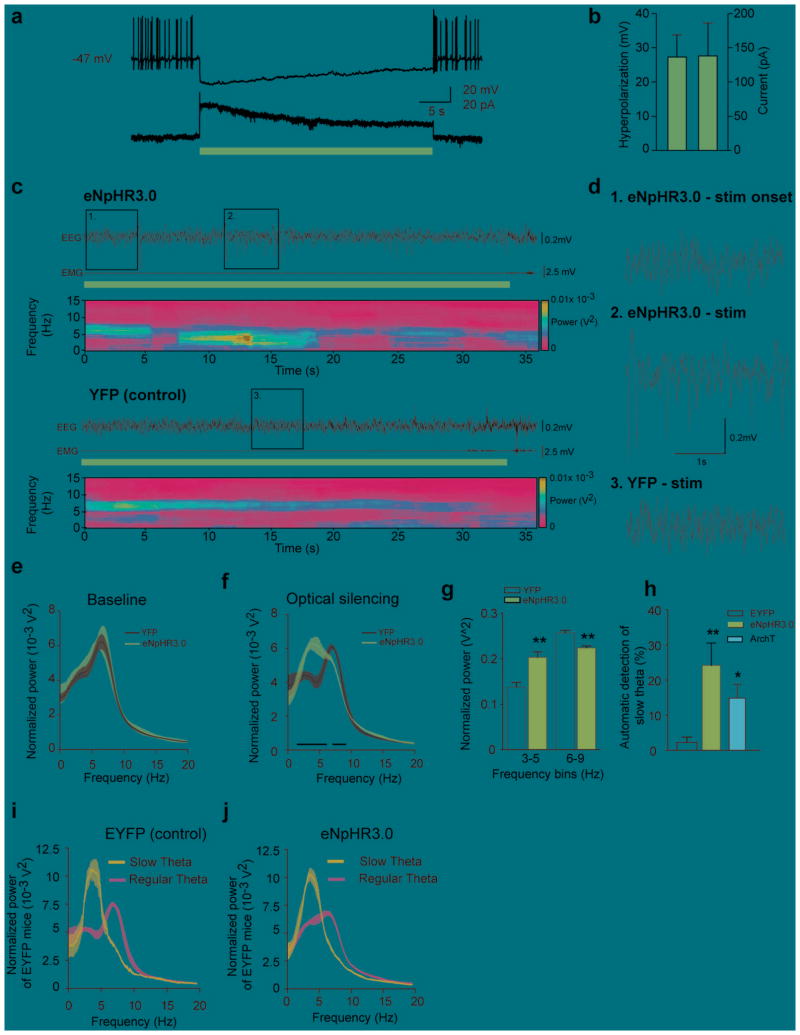
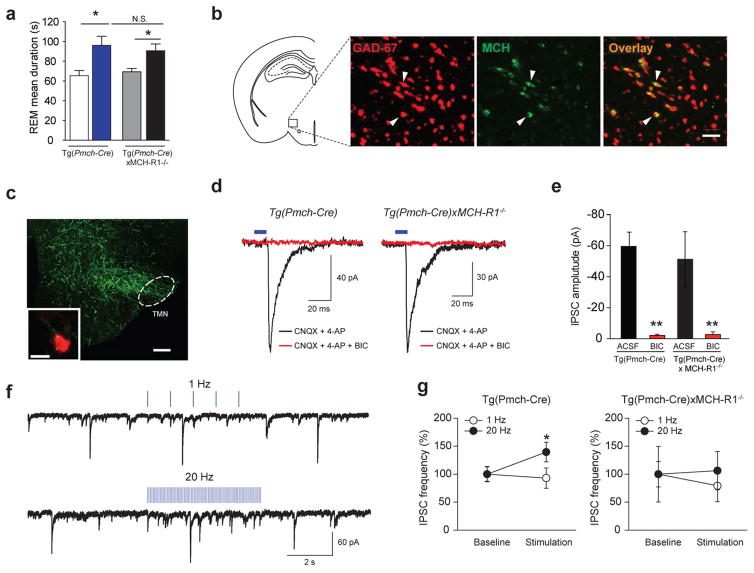
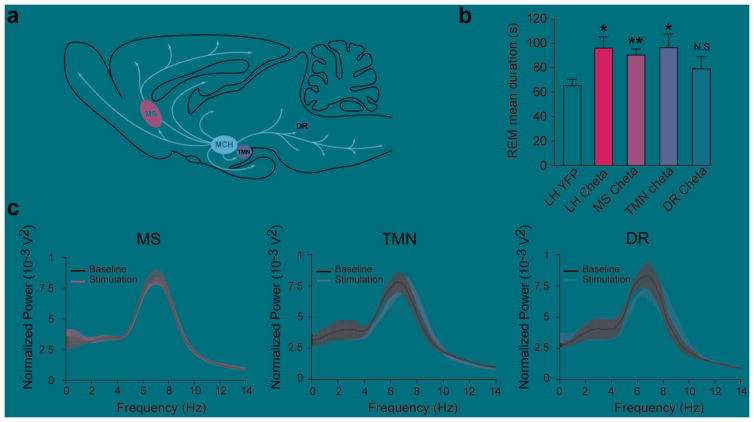
Rapid-eye movement (REM) sleep correlates with neuronal activity in the brainstem, basal forebrain and lateral hypothalamus. Lateral hypothalamus melanin-concentrating hormone (MCH)-expressing neurons are active during sleep, but their effects on REM sleep remain unclear. Using optogenetic tools in newly generated Tg(Pmch-cre) mice, we found that acute activation of MCH neurons (ChETA, SSFO) at the onset of REM sleep extended the duration of REM, but not non-REM, sleep episodes. In contrast, their acute silencing (eNpHR3.0, archaerhodopsin) reduced the frequency and amplitude of hippocampal theta rhythm without affecting REM sleep duration. In vitro activation of MCH neuron terminals induced GABAA-mediated inhibitory postsynaptic currents in wake-promoting histaminergic neurons of the tuberomammillary nucleus (TMN), and in vivo activation of MCH neuron terminals in TMN or medial septum also prolonged REM sleep episodes. Collectively, these results suggest that activation of MCH neurons maintains REM sleep, possibly through inhibition of arousal circuits in the mammalian brain.


Figures

Figure 1
Figure 1. Selective targeting and functional expression of optogenetic tools in MCH neurons
a, Generation Tg(Pmch-Cre) mice using BAC technology. b, Photomicrograph of a brain section from [Tg(Pmch-Cre) X R26tom] mouse showing colocalization of tdTomato-positive cells (red) with MCH immuno-positive cells (green). Scale bar: 500 μm. Inset, magnification of hypothalamus area. White arrowheads represent MCH+/Cre+ cells. Open arrowhead represent MCH+/Cre– cell. Scale bar: 50 μm. c, Photomicrograph of ChETA-EYFP expression in the hypothalamus. Scale bar: 500 μm. d, Photomicrographs of ChETA-EYFP expression (green) within MCH neurons (red). White arrowheads represent MCH-positive cell expressing ChETA-EYFP. Open arrowhead represents non-transfected MCH neurons. Scale bar: 20 μm. e, MCH neurons transfected with AAVdj-ChETA-EYFP show typical firing-rate adaptation of wild-type MCH neurons in response to excitatory current injection (100 pA). f, ChETA-expressing MCH neurons show robust depolarization and spiking (top) upon 500-ms illumination (473 nm light) in current-clamp mode. This depolarization coincided with inward current in voltage-clamp mode (bottom). g, Quantification of voltage depolarization and inward currents of ChETA-expressing MCH neurons upon blue light illumination (n = 7 cells in 7 different slices, n=6 animals). h, Brief pulses of 473-nm light evoke single action potentials in ChETA-expressing MCH neurons. Note that pulse width > 20 ms typically resulted in spike doublets. i, Voltage responses of MCH cell shown in (e) to 20 pulses of blue light delivered at various frequencies (1–20 Hz). Blue bars represent 5-ms light pulses. j, Group data showing ChETA-expressing MCH neurons fidelity response to light pulses at frequencies up to 20 Hz (n = 7cells in 7 different slices, n=6 animals).
Figure 2
Figure 2. Optogenetic activation of MCH neurons extends REM, but not NREM sleep duration
a, Mean duration of NREM sleep upon optogenetic stimulation at 1 Hz and 20 Hz of control (white) and ChETA-EYFP group (blue) animals (n = 6 per group; > 15 stimulations per frequency and per animal). b, Percentage of successful NREM-to-REM sleep transitions upon optogenetic stimulation during NREM sleep shown in (a). Data are shown as a percentage of total number of NREM-to-REM sleep transitions on the total number of stimulation during NREM sleep (n = 6 animals per group). c, Mean duration of REM sleep episodes upon optogenetic stimulation at 1 Hz and 20 Hz of control (white) and ChETA-EYFP (blue) animals (n = 6 per group). Data analysis is based on an average of at least 15 stimulations per frequency and per animal during REM sleep episodes. d, Power spectrum analysis of REM sleep episodes upon 20 Hz optogenetic stimulation of control (black) and ChETA-EYFP (blue) animals (n = 6 per group).
Figure 3
Figure 3. SSFO activation of MCH neurons extends REM sleep duration
a, Whole-cell voltage clamp recording from a MCH neuron expressing SSFO-EYFP shows a prolonged inward current upon blue light pulse (50 ms delivered every 10 s) that is terminated by a 50-ms yellow pulse. b, Quantification of membrane depolarization and inward currents of SSFO-expressing MCH neurons upon optogenetic stimulation (n = 8 cells in 5 slices, n = 3 animals). c, d, Quantification of REM (g) and NREM (h) sleep mean duration upon optogenetic stimulation (50 ms blue pulse delivered every 10 s; termination: 50 ms yellow pulse, see Methods) of EYFP and SSFO-EYFP animals (n = 4 per group). Data analysis is based on an average of at least 10 stimulations per frequency in each mouse during REM and NREM sleep episodes. Mean duration are represented as mean ± SEM. *, p<0.05, **, p<0.01 two-way mixed factorial ANOVA between stimulation condition and viral transduction, followed by Tukey post-hoc test or unpaired two tailed t test.
Figure 4
Figure 4. Optogenetic silencing of MCH neurons induced shift in the dominant theta peak frequencies towards slower oscillations
a, eNpHR3.0-expressing MCH neurons show a persistent hyperpolarization (top) and outward current (bottom) upon 30-s constant yellow light illumination in current and voltage clamp, respectively. b, Quantification of membrane hyperpolarization and outward currents of eNpHR3.0-expressing MCH neurons upon optogenetic silencing (n= 8 cells in 5 slices, n=3 animals). c, Representative EEG/EMG recordings and EEG power spectrum during optogenetic silencing (horizontal yellow bars) in eNpHR3.0-YFP (top) and EYFP (bottom) animals during REM sleep. d, Magnification of the boxes in figure (c). Note the high amplitude slow theta oscillations few seconds after the onset of optogenetic silencing in eNpHR3.0 animals. e-f, Average spectral distribution of relative cortical EEG power densities during baseline (e) and optogenetic silencing (f) in EYFP and eNpHR3.0-YFP animals (n = 5 per group; > 15 stimulations per frequency per animal). g, Quantification of slow theta oscillations shown in (f) upon optogenetic silencing of control and eNpHR3.0-YFP animals (n = 5 per group). Normalized power densities are represented as mean ± SEM. *, p<0.05, **p<0.01, unpaired two-tailed t test. h, automatic detection of slow theta oscillations during optogenetic silencing of MCH neurons in control, eNpHR3.0 and ArchT animals. Percentage of detected events are represented as mean ± SEM. *, p<0.05 **, p<0.01, unpaired two-tailed t test between control and eNpHR3.0 or ArchT animals. i, j, Average spectral distribution of slow and regular theta oscillations during optogenetic silencing of MCH neurons in control (i) and eNpHR3.0 (j) animals. Note the similar power spectrum profile between control and eNpHR3.0 animals.
Figure 5
Figure 5. MCH neurons release the inhibitory transmitter GABA
a, Mean duration of REM sleep episodes upon 20 Hz optogenetic stimulation of Tg(Pmch-Cre) and [Tg(Pmch-Cre) X MCH-R1−/−] animals transduced with YFP or ChETA-EYFP viruses (n=6 per group; > 10 stimulations per animal). Data are represented as mean ± SEM. *, p<0.05 two-way ANOVA between genotype and viral transduction, followed by Tukey post-hoc test. b, Photomicrograph showing colocalization of GAD-67 transcripts (red) with MCH peptide (green). Scale bar: 100 μm. c, Photomicrograph showing ChETA-EYFP-expressing MCH terminals in TMN area. Scale bar: 200 μm. Inset, ChETA-EYFP-expressing MCH terminals (green) contacting histamine cell (red). Scale bar: 10 μm. d, IPSCs (black) were recorded in TMN histamine and non-histamine neurons (n=3 and 13, respectively) from Tg(Pmch-Cre) (left trace) and [Tg(Pmch-Cre) X MCH-R1−/−] animals (right trace) transduced with ChETA-EYFP viruses. Optically-evoked responses (black traces) were blocked by bicuculline (BIC, red traces). e, Mean amplitude of evoked IPSCs from Tg(Pmch-Cre) (n =9 cells in 7 slices, n=6 animals, left) and [Tg(Pmch-Cre) X MCH-R1−/−] (n=5 cells in 4 slices, n=3 animals, right) before and after bath application of BIC. f, Optogenetic stimulation of ChETA-expressing MCH axons at 20 Hz induced IPSC frequency in histamine neurons in Tg(Pmch-Cre), whereas 1-Hz stimulation did not. g, Mean IPSC frequency upon 20 Hz stimulation in Tg(Pmch-Cre) (left panel, n=10 cells in 7 slices, n=7 animals) and Tg(Pmch-Cre)xMCH-R1−/− (right panel, n= 5 cells in 4 slices, n=3 animals) animals. Mean IPSC amplitudes, latencies, and frequencies are represented as mean ± SEM. *, p<0.05, **, p<0.01, paired samples two tailed t-test.
Figure 6
Figure 6. MCH neurons control REM sleep duration trough multiple pathways
a, Schematic of the MCH neuron projections in the rodent brain (based on Bittencourt et al (1992). Note the presence of MCH projection to the MS, TMN and DR. b, Mean REM sleep duration of animals stimulated at 20Hz during REM sleep in the TMN (n = 4 animals; bilateral), the DR (n = 4 animals; unilateral) or the MS (n = 6 animals; unilateral). Results of LH stimulation (LH ChETA) from Fig. 2c were reported for comparison. c, Average spectral distribution of relative cortical EEG power density during baseline (black) compared to stimulation (blue) of ChETA-containing MCH terminals within MS (left), TMN (center) and DR (right). Data analysis is based on an average of at least 10 stimulations per frequency for each mouse during REM sleep episodes. Mean duration are represented as mean ± SEM. *, p<0.05, **, p<0.01, unpaired two-tailed t test between YFP animal and ChETA animals in a given target.

References

    1. JOUVET M. Research on the neural structures and responsible mechanisms in different phases of physiological sleep. Arch Ital Biol. 1962;100:125–206. - PubMed
    1. Saper CB, Fuller PM, Pedersen NP, Lu J, Scammell TE. Sleep state switching. Neuron. 2010;68:1023–1042. - PMC - PubMed
    1. McGinty DJ, Harper RM. Dorsal raphe neurons: depression of firing during sleep in cats. Brain Res. 1976;101:569–575. - PubMed
    1. Aston-Jones G, Bloom FE. Activity of norepinephrine-containing locus coeruleus neurons in behaving rats anticipates fluctuations in the sleep-waking cycle. J Neurosci. 1981;1:876–886. - PMC - PubMed
    1. McCarley RW, Hobson JA. Neuronal excitability modulation over the sleep cycle: a structural and mathematical model. Science. 1975;189:58–60. - PubMed

Publication types

MeSH terms