

Review
doi: 10.1039/c3cs60201j.
Protein induced fluorescence enhancement (PIFE) for probing protein-nucleic acid interactions
Affiliations
- PMID: 24056732
- PMCID: PMC4142350
- DOI: 10.1039/c3cs60201j
Item in Clipboard
Review
Protein induced fluorescence enhancement (PIFE) for probing protein-nucleic acid interactions
Chem Soc Rev.
.
Abstract
Single molecule studies of protein-nucleic acid interactions shed light on molecular mechanisms and kinetics involved in protein binding, translocation, and unwinding of DNA and RNA substrates. In this review, we provide an overview of a single molecule fluorescence method, termed "protein induced fluorescence enhancement" (PIFE). Unlike FRET where two dyes are required, PIFE employs a single dye attached to DNA or RNA to which an unlabeled protein is applied. We discuss both ensemble and single molecule studies in which PIFE was utilized.
Figures
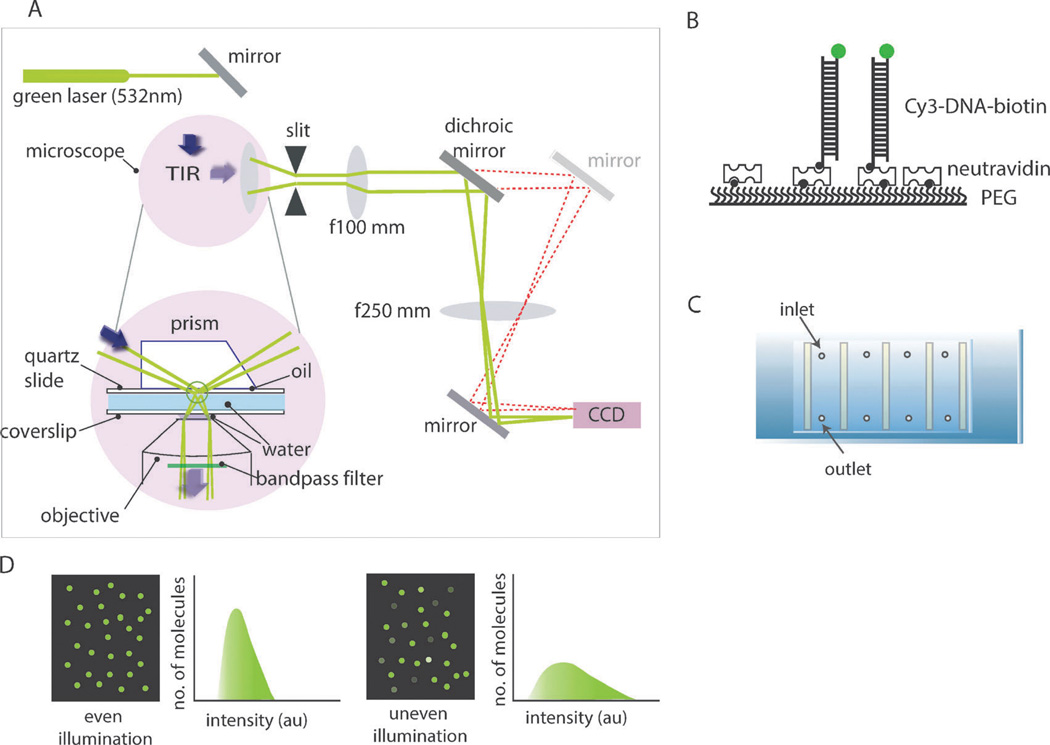
(A) Schematic diagram of the prism-type total internal fluorescence microscope (TIRFM) setup. (B) Fluorescently labeled and biotinylated-DNA immobilized to a polymer (PEG)-coated surface via biotin–NeutrAvidin interactions. (C) Slide assembly with flow chambers constructed for single molecule imaging. (D) Examples of even and uneven laser illumination of the single molecule surface.
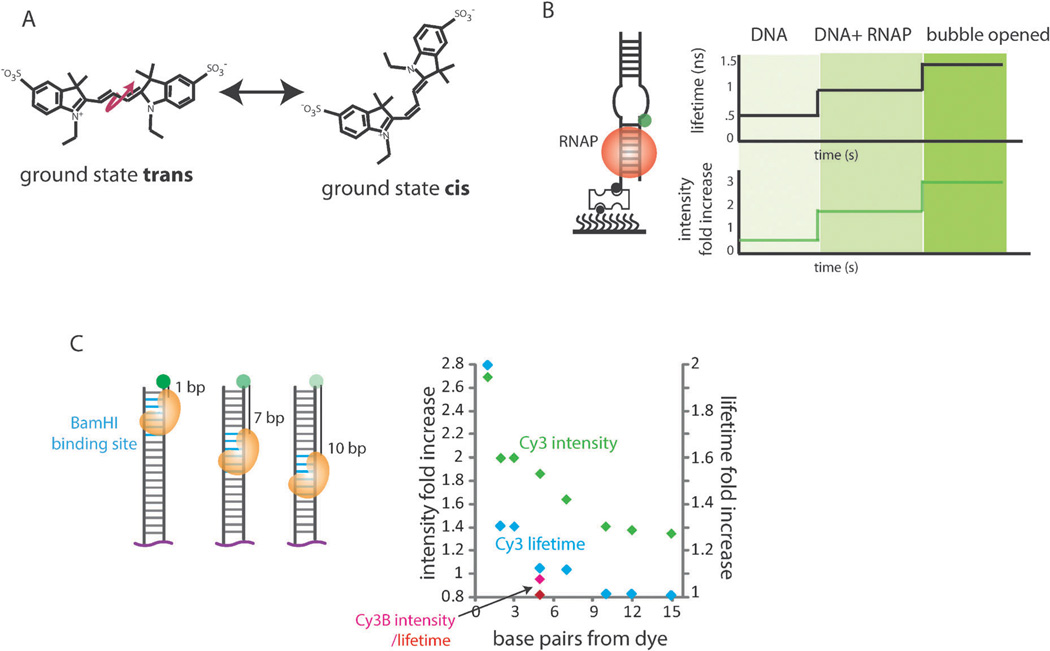
(A) cis–trans Isomerization of a Cy3 dye. The pink arrow indicates the rotation with respect to the carbon–carbon double bonds. (B) Schematic of T7 RNA polymerase (RNAP) binding to a duplex DNA. Lifetime and PIFE measurements for DNA alone, with RNAP, and when the DNA bubble is opened. (C) Schematic of the BamHI binding site positioned 1, 7 and 10 bp away from the Cy3 fluorophore. Intensity fold and lifetime fold increases are shown for 1–15 bp distances away from the dye.
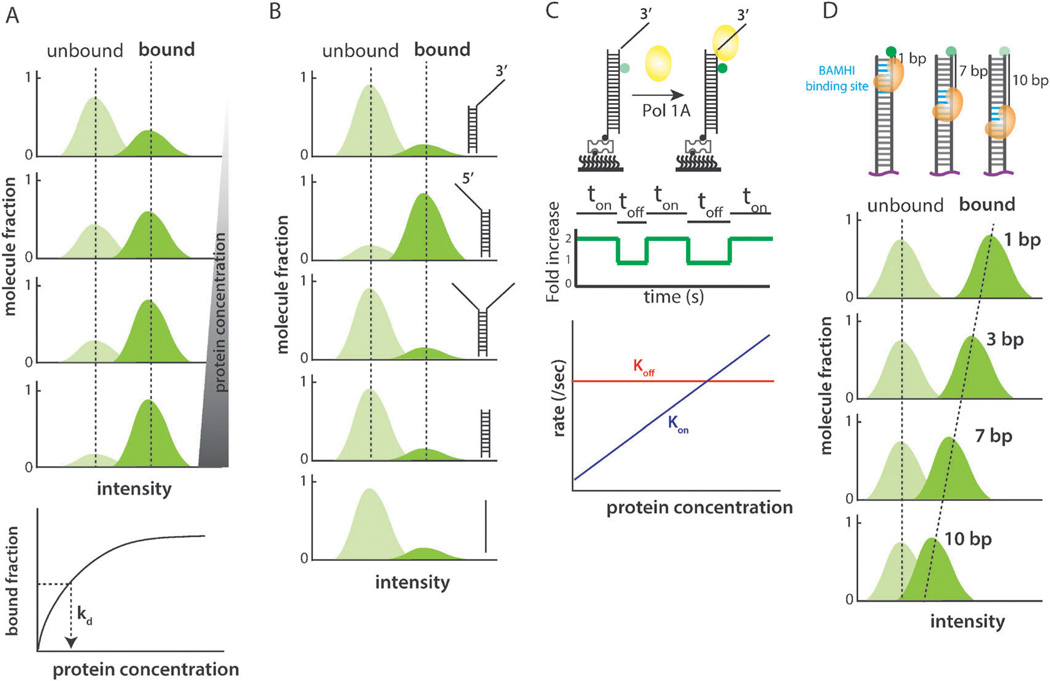
(A) Fluorescence intensity histograms collected from various protein concentrations. The bound fraction plotted as a function of protein concentration to extract the dissociation constant, Kd. (B) Fluorescence intensity histograms collected for different substrates to test a given protein’s binding specificity. (C) When Pol1A binds, fluorescence intensity increases. Dwell times, ton and toff, can be collected, inversed, and plotted as rates, kon and kofif (D) Fluorescence intensity histograms can provide details on approximate binding position of a given protein.
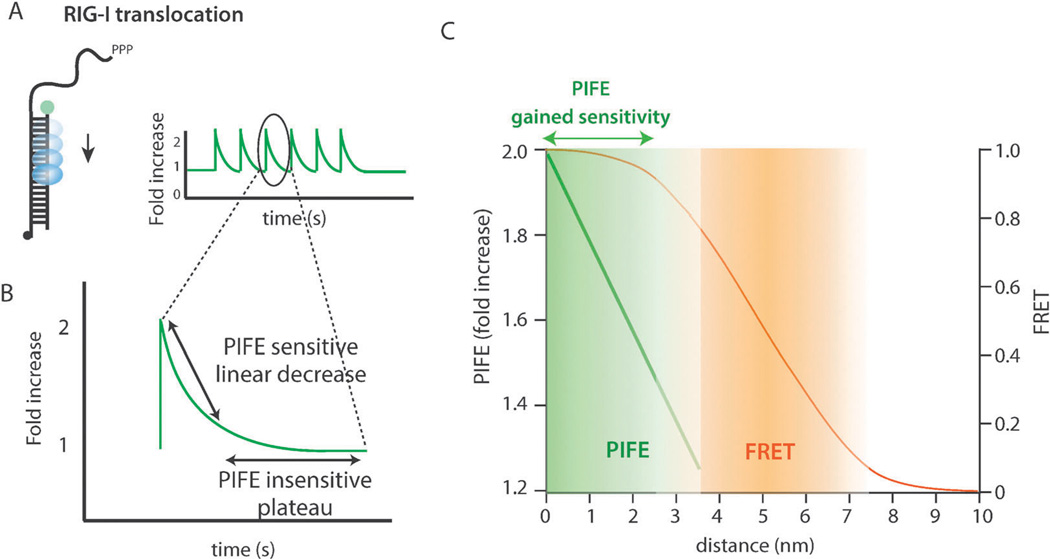
(A) Schematic and single molecule PIFE traces of Rig-I translocation on dsRNA. (B) A single translocation exhibiting a PIFE-sensitive linear region and a PIFE-insensitive plateau region. (C) Distance sensitivity of PIFE and FRET.
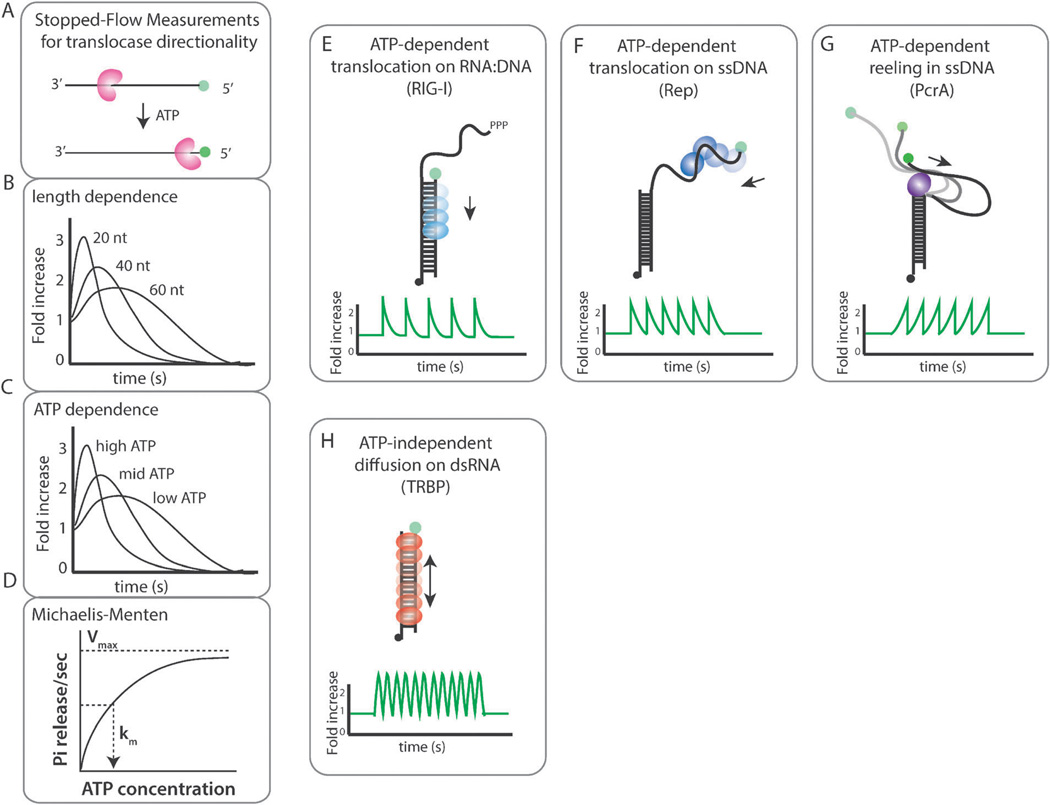
(A) Schematic for stopped-flow measurements. Substrate length (B) and ATP concentration (C) variation for stopped-flow measurements. (D) Km and Vmax can be extracted from the rate of phosphate release plotted as a function of ATP concentration. (E) smPIFE visualization of RIG-I translocation across dsRNA showing repetitive translocation. (F) smPIFE measurements of Rep translocation is consistent with repetitive shuttling. (G) smPIFE trace reflects PcrA reeling in ssDNA in repetition. (H) Fast intensity fluctuations of the smPIFE trace reflects TRBP’s diffusion along the dsRNA axis.
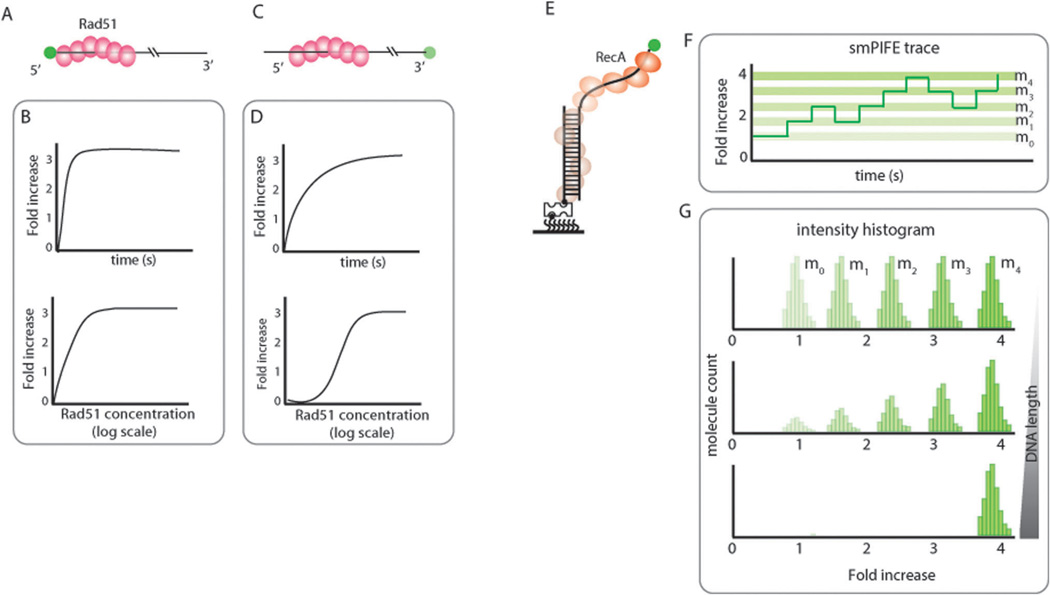
Directionality of Rad51 formation schematic can be monitored by stopped-flow experiments with the Cy3 fluorophore attached at either 5’ (A) or 3’ end (C). Intensity increase over time and at various Rad51 concentrations can reflect the directionality of Rad51 binding and filament formation (B and D). (E) Schematic of RecA forming filaments on DNA visualized with smPIFE. (F) Addition and dissociation of each RecA monomer can be visualized as a step-wise increase and decrease in fluorescence intensity, respectively. (G) RecA filament stability can be tested by varying the length of ssDNA. A stable filament formed on a long enough substrate will show one high PIFE intensity peak whereas an unstable filament will produce multiple PIFE peaks of varying intensity.
References
-
- Joo C, Balci H, Ishitsuka Y, Buranachai C, Ha T. Advances in single-molecule fluorescence methods for molecular biology. Annu. Rev. Biochem. 2008;77:51–76. - PubMed
-
- Aramendia PF, Negri RM, Sanroman E. Temperature-Dependence of Fluorescence and Photoisomerization in Symmetrical Carbocyanines - Influence of Medium Viscosity and Molecular-Structure. J. Phys. Chem. 1994;98:3165–3173.
-
- Fischer CJ, Lohman TM. ATP-dependent translocation of proteins along single-stranded DNA: models and methods of analysis of pre-steady state kinetics. J. Mo.l Biol. 2004;344:1265–1286. - PubMed
Publication types
MeSH terms
Substances
Grants and funding
LinkOut - more resources
Full Text Sources
Other Literature Sources