. 2013 Nov;14(11):1190-8.
doi: 10.1038/ni.2712. Epub 2013 Sep 22.

Expression and regulation of intergenic long noncoding RNAs during T cell development and differentiation

Affiliations

Expression and regulation of intergenic long noncoding RNAs during T cell development and differentiation

Gangqing Hu et al. Nat Immunol. 2013 Nov.

Abstract

Although intergenic long noncoding RNAs (lincRNAs) have been linked to gene regulation in various tissues, little is known about lincRNA transcriptomes in the T cell lineages. Here we identified 1,524 lincRNA clusters in 42 T cell samples, from early T cell progenitors to terminally differentiated helper T cell subsets. Our analysis revealed highly dynamic and cell-specific expression patterns for lincRNAs during T cell differentiation. These lincRNAs were located in genomic regions enriched for genes that encode proteins with immunoregulatory functions. Many were bound and regulated by the key transcription factors T-bet, GATA-3, STAT4 and STAT6. We found that the lincRNA LincR-Ccr2-5'AS, together with GATA-3, was an essential component of a regulatory circuit in gene expression specific to the TH2 subset of helper T cells and was important for the migration of TH2 cells.


Figures
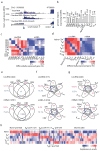
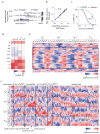
Figure 1
Figure 1. Identification and lineage-specific expression of lincRNAs
(a) Genome browser image showing a lincRNA cluster containing two lincRNAs from the Watson and Crick strands determined by strand-specific RNA-Seq. Promoters are marked by blue arrows. Y-axis: number of reads per genomic position per million reads (RPM). (b) Total number of lincRNAs in DN, DP, CD4+, CD8+ SP and tTreg cells harvested ex vivo, TH1, TH2, TH17 and iTreg subsets obtained in vitro following two weeks of cell polarization. (c, d) Heat maps showing differentially expressed lincRNAs and mRNAs (Fold > 2, FDR < 0.01) between any two subsets of T cells from DN cells to SP cells (c) and from naïve CD4+ T cells to distinctive TH cells at two weeks (d). (e–g) Venn diagrams showing cell-specific and common lincRNAs (upper) and mRNAs (lower) among different DN (e), DP, SP and tTreg (f), and TH cell subsets (g). The % of specifically (purple) and commonly (blue) expressed genes are indicated. (h) Heat map of hierarchical cluster analysis of lincRNA expression in naïve CD4+ T cell, TH1, TH2, TH17 and iTreg cell subsets following two weeks of culture. Each column represents one lincRNA cluster of which the expression values were transformed into z-scores. A lincRNA was denoted as “X-pref” if its expression in lineage X is 1.5-fold higher than the maximum from other lineages, or otherwise denoted as “shared”. Expression values for ch were assessed by total RNA-Seq. Data are from biological duplicates.
Figure 2
Figure 2. Dynamic regulation of lincRNA expression during T cell differentiation
(a) Genome browser image showing the distribution of polyA+ RNA-Seq and total RNA-Seq reads of TH2 cells obtained in vitro following 2 weeks of cell polarization, across the LincR-Gata3-3′ cluster. (b) Scatter plot of the expression of LincR-Gata3-3′ determined by polyA+ RNA-Seq and by total RNA-Seq of different TH subsets listed in Supplemental Table 2. (c) Inverse cumulative distribution of Pearson correlation coefficient between the expressions of lincRNA assessed by polyA+ RNA-Seq and by total RNA-Seq from the same TH subsets as (b). (d) Heat map of the numbers of lincRNA expressed at multiple time points during cell differentiation from naïve CD4+ T cells (N) into different TH cells. (e) Heat map of gene expression at multiple time points as in (d) for lincRNAs expressed in naïve CD4+ T cells, with those first down-regulated and then re-activated highlighted in red rectangle. (f) Heat map of hierarchical cluster analysis of gene expression at multiple time points as in (d) for all lincRNAs excluding those not expressed in any subset. Each column represents one lincRNA of which the expression values were transformed into z-scores. A lincRNA was denoted as “X-pref” if the maximal expression across all time points of lineage X is 1.5-fold higher than the maximum from any other combination of lineage and time point, or otherwise denoted as “shared”. Expression values for (df) were assessed by polyA+ RNA-Seq. Data are from biological duplicates.
Figure 3
Figure 3. STATs regulate lincRNA expression
(a) Genome browser image showing the distributions of polyA+ RNA-Seq reads of the wild type and STAT4-deficient TH1 cells across the LincR-Gng2-5′AS cluster and the distributions of STAT4, p300 and H3K4me3 ChIP-Seq reads of wild type in the same region. (b) Cumulative distributions of STAT4 ChIP-Seq read density at promoters of TH1-preferred and non-TH1-preferred lincRNAs in wild type TH1 cells. (c) Percentages of lincRNAs down-regulated (left) or up-regulated (right) in the STAT4-deficient cells for TH1-preferred and non-TH1-preferred lincRNAs. (d) Percentages of lincRNAs down-regulated (left) or up-regulated (right) in the STAT4-deficient cells for equal-size groups of lincRNAs with low, intermediate and high levels of STAT4 binding at promoters in wild type TH1 cells. (e) Genome Browser image showing the distributions of polyA+ RNA-Seq reads of the wild type and STAT6-deficient TH2 cells across the LincR-Epas1-3′AS cluster and the distributions of STAT6, p300 and H3K4me3 ChIP-Seq reads of wild type in the same region. (f) Cumulative distributions of STAT6 ChIP-Seq read density at promoters of TH2-preferred and non-TH2-preferred lincRNAs in wild type TH2 cells. (g) Percentages of lincRNAs down-regulated (left) or up-regulated (right) in the STAT6-deficient cells for TH2-preferred and non-TH2-preferred lincRNAs. (h) Percentages of lincRNAs down-regulated (left) or up-regulated (right) in the STAT6-deficient cells for equal-size groups of lincRNAs with low, intermediate and high levels of STAT6 binding at promoters in the wild type. P-value calculation: Kolmogorov-Smirnov test (b, f) and χ2-test (c, d, g, h). ** P-value < 0.01, * P-value < 0.05 and NS P-value ≥0.05. Data are from one experiment with three independent pools of TH cells.
Figure 4
Figure 4. T-bet regulates expression of lincRNAs in TH1 cells
(a, b) Genome browser images showing distributions of total RNA-Seq reads of naïve CD4 T cells and other TH cells across the LincR-Ifng-3′AS cluster (a) or the LincR-Ccr2-5′AS cluster (b) and T-bet ChIP-Seq peaks (arrowheads) of wild type cells in the same region. (c) Cumulative distribution of T-bet ChIP-Seq read density at promoters of TH1-preferred (249) and non-TH1-preferred lincRNAs in wild type TH1 cells. TH1-preferred lincRNA was defined as in Fig. 1h. ** P-value < 0.01 (Kolmogorov-Smirnov test). (d) Genome browser images showing the distributions of total RNA-Seq reads of wild type and Tbx21−/− TH1 cells following two weeks of polarization across LincR-Ifng-3′AS (upper) and LincR-Ccr2-5′AS (lower) clusters. (e) MA plot for the ratio of expression (Tbx21−/−/wild type) and the average expression of lincRNA between Tbx21−/− and wild type TH1 cells obtained following 2 weeks of cell polarization. Shown in the background were smoothed from protein-coding genes. LincRNAs with significant changes in expression are highlighted in red (FC > 1.5 and FDR < 0.05). Data are from biological duplicates.
Figure 5
Figure 5. GATA-3 regulates expression of lincRNAs in TH2 cells
(a) Cumulative distributions of GATA-3 ChIP-Seq read density at promoters of TH2-preferred (186) and non-TH2-preferred lincRNAs in wild type TH2 cells. TH2-preferred lincRNA was defined as in Fig. 1h. ** P-value < 0.01 (Kolmogorov-Smirnov test). (b) Cumulative distribution of expression level of lincRNAs bound (+GATA-3) by and unbound (−GATA-3) by GATA-3 at promoters in wild type TH2 cells (two weeks). ** P-value < 0.01 (Kolmogorov-Smirnov test). (c) Genome browser image showing the distributions of total RNA-Seq reads of Gata3−/− and wild type TH2 cells across the LincR-Ccr2-5′AS cluster and GATA-3 ChIP-Seq peaks (arrowheads) of wild type in the same region. (d) Percentages of lincRNAs down-regulated (left) or up-regulated (right) in the Gata3−/− TH2 cells for GATA-3 bound (+GATA-3) and unbound (-GATA-3) lincRNAs. (e) Percentages of lincRNAs exhibiting at least one nearby (± 100K bps) protein-coding gene down-regulated (left) or up-regulated (right) by Gata3 deletion for three groups of lincRNAs sorted based on their responses to GATA-3 deficiency in TH2 cells: down-regulated in gene expression (175), up-regulated (71) and not changed; lincRNAs containing both up-regulated and down-regulated genes or containing no genes within 100K bps were excluded. ** P-value < 0.01 (χ2-test). Data are from one experiment with two independent pools of TH2 cells.
Figure 6
Figure 6. LincR-Ccr2-5′AS regulates gene expression and migration of TH2 cells
(a) Genome Browser image showing the distributions of total RNA reads from control (shLuc) or LincR-Ccr2-5′AS knockdown (sh36 and sh40) TH2 cells across genes Ccr1, Ccr3, Ccr2, LincR-Ccr2-5′AS, and Ccr5, and the distribution of H3K4me3 reads of wild type in the same region. Inset: a zoomed view of the top three tracks across LincR-Ccr2-5′AS (see different scale of Y-axis). (b) Migration efficiency determined by the ratio of CD45.2+GFP+ TH2 cells expressing shLuc (n=5), sh36 (n=4) or sh40 (n=4) to CD45.1+ WT TH2 cells recovered from the lungs of the recipient C57BL/6 mice 20hr after co-transfer; the mean for the shLuc group was set as 1. ** P-value < 0.01 (one-tailed t-test). (c) Pie graph of all (left) or TH2-preferred (right) protein-coding genes up-regulated, down-regulated and unchanged by LincR-Ccr2-5′AS depletion in TH2 cells. TH2-preferred lincRNA was defined as in Fig. 1h. (d) Box plot of Pearson correlation coefficient (r) of expressions between LincR-Ccr2-5′AS and protein-coding genes sorted by their responses to LincR-Ccr2-5′AS depletion in TH2 cells: up-regulated (709), down-regulated (656) and unchanged (9,329). ** P-value < 0.01 (one tailed t-test). (e) Percentages of down-regulated (left) and up-regulated (right) genes for protein-coding genes sorted by their similarity in gene expression (r) to LincR-Ccr2-5′AS: r > 0.6 (119), r < −0.6 (100) and others. ** P-value < 0.01, NS P-value > 0.05, NA not determined (χ2-test). r calculation followed that in Supplemental Fig. 3a. Data are from one experiment.

References

    1. Cabili MN, et al. Integrative annotation of human large intergenic noncoding RNAs reveals global properties and specific subclasses. Genes Dev. 2011;25:1915–27. - PMC - PubMed
    1. Derrien T, et al. The GENCODE v7 catalog of human long noncoding RNAs: analysis of their gene structure, evolution, and expression. Genome Res. 2012;22:1775–89. - PMC - PubMed
    1. Rinn JL, Chang HY. Genome regulation by long noncoding RNAs. Annu Rev Biochem. 2012;81:145–66. - PMC - PubMed
    1. Spizzo R, Almeida MI, Colombatti A, Calin GA. Long non-coding RNAs and cancer: a new frontier of translational research? Oncogene. 2012;31:4577–87. - PMC - PubMed
    1. Payer B, Lee JT. X chromosome dosage compensation: how mammals keep the balance. Annu Rev Genet. 2008;42:733–72. - PubMed

Publication types

MeSH terms

Associated data