. 2013 Oct;19(10):1264-72.
doi: 10.1038/nm.3337. Epub 2013 Sep 22.

CSF-1R inhibition alters macrophage polarization and blocks glioma progression

Affiliations

CSF-1R inhibition alters macrophage polarization and blocks glioma progression

Stephanie M Pyonteck et al. Nat Med. 2013 Oct.

Abstract

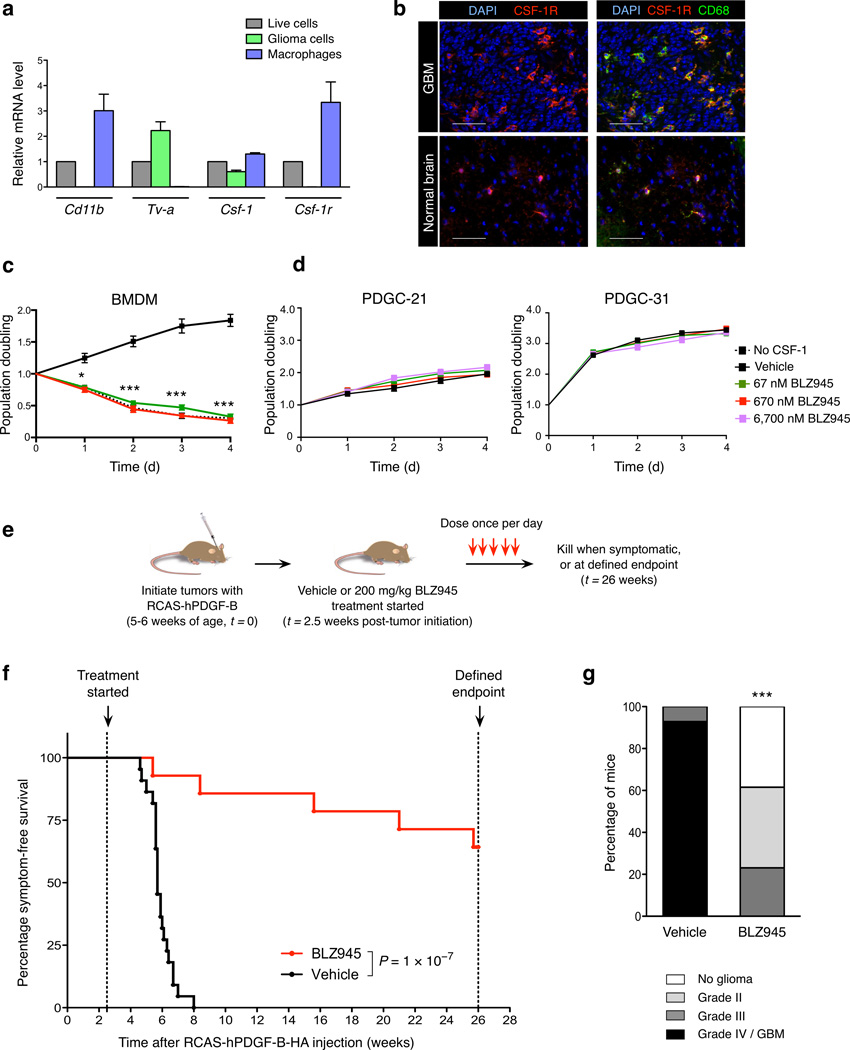
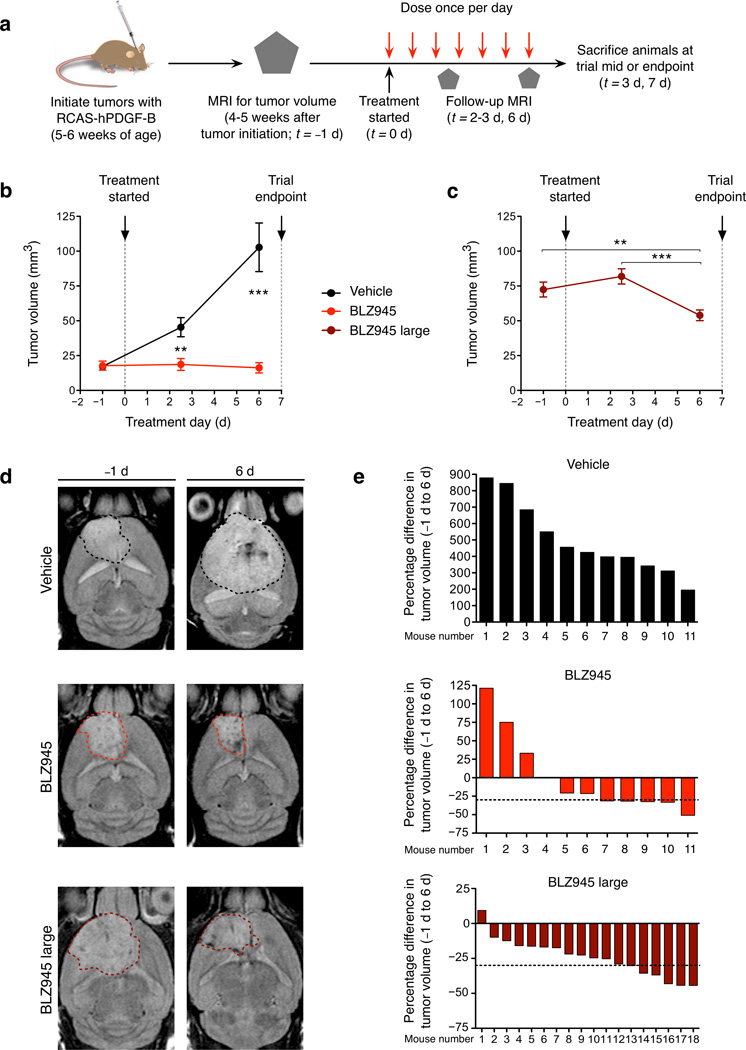
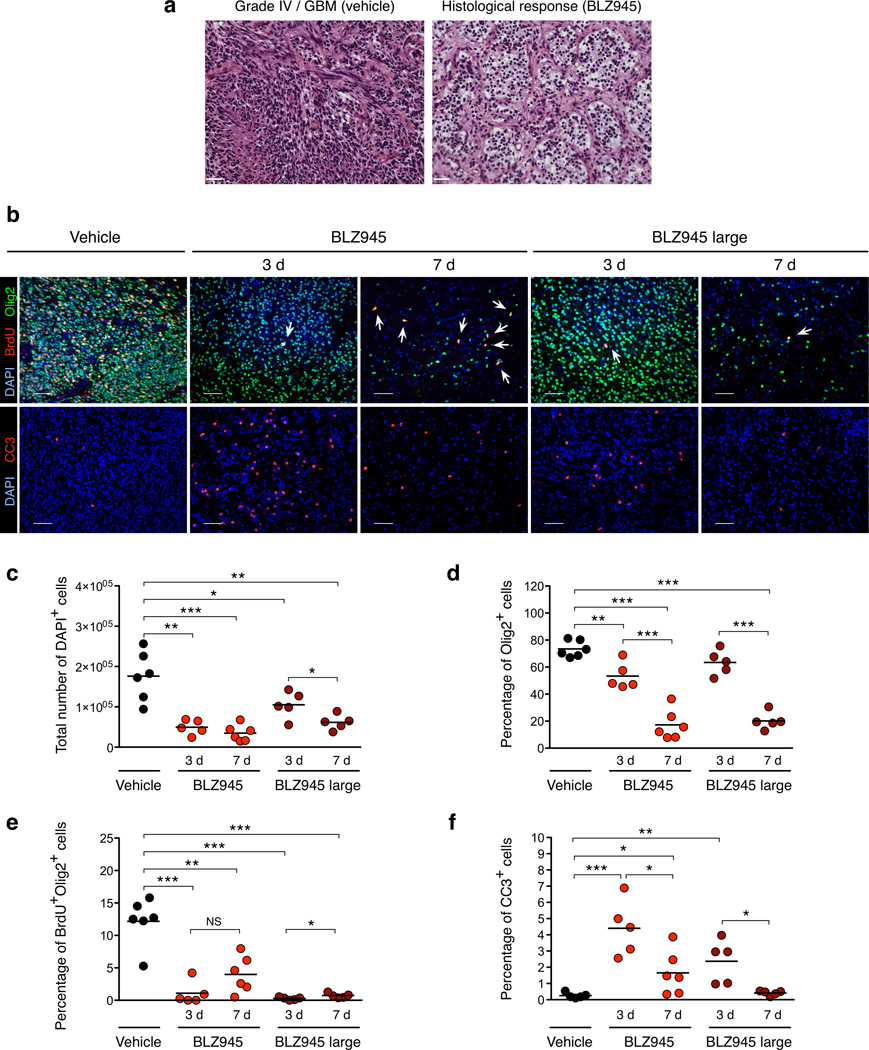
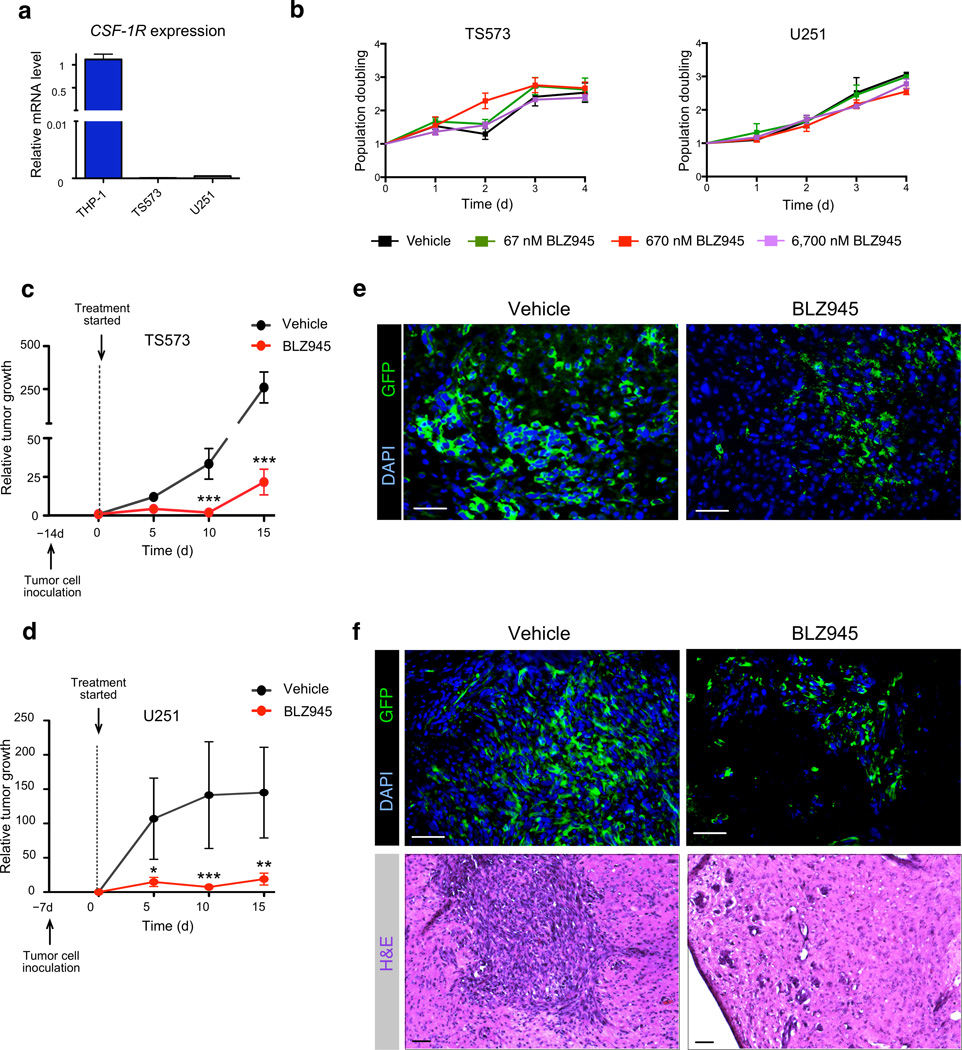
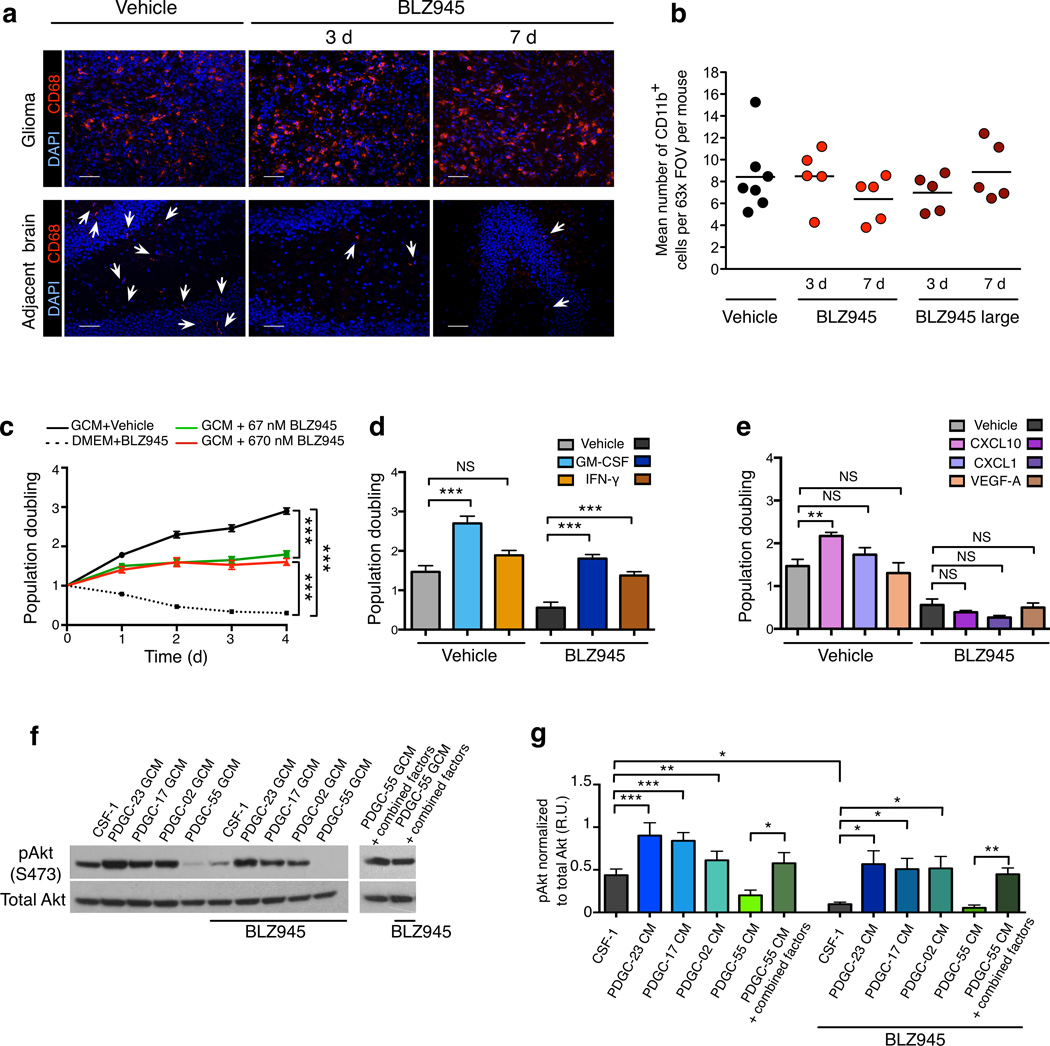
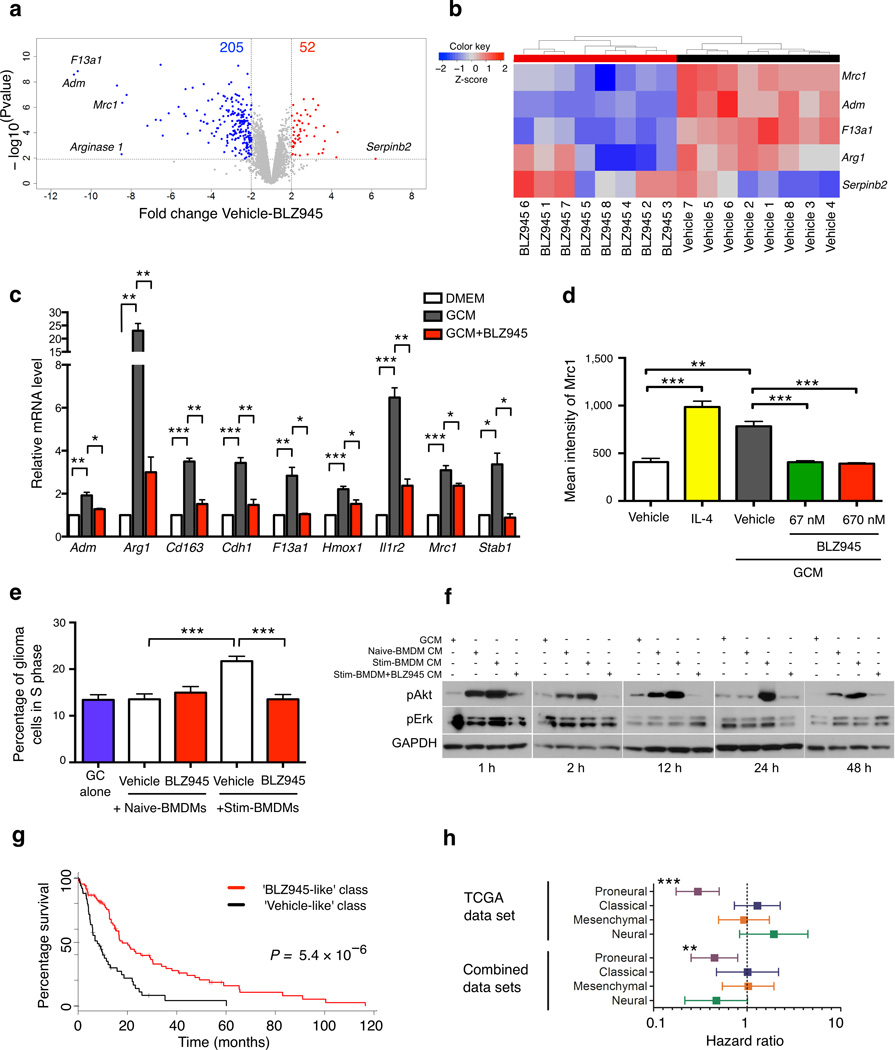
Glioblastoma multiforme (GBM) comprises several molecular subtypes, including proneural GBM. Most therapeutic approaches targeting glioma cells have failed. An alternative strategy is to target cells in the glioma microenvironment, such as tumor-associated macrophages and microglia (TAMs). Macrophages depend on colony stimulating factor-1 (CSF-1) for differentiation and survival. We used an inhibitor of the CSF-1 receptor (CSF-1R) to target TAMs in a mouse proneural GBM model, which significantly increased survival and regressed established tumors. CSF-1R blockade additionally slowed intracranial growth of patient-derived glioma xenografts. Surprisingly, TAMs were not depleted in treated mice. Instead, glioma-secreted factors, including granulocyte-macrophage CSF (GM-CSF) and interferon-γ (IFN-γ), facilitated TAM survival in the context of CSF-1R inhibition. Expression of alternatively activated M2 markers decreased in surviving TAMs, which is consistent with impaired tumor-promoting functions. These gene signatures were associated with enhanced survival in patients with proneural GBM. Our results identify TAMs as a promising therapeutic target for proneural gliomas and establish the translational potential of CSF-1R inhibition for GBM.


Figures

Figure 1
Figure 1. CSF-1R inhibition specifically targets macrophages, improves survival and decreases glioma malignancy in the transgenic PDG model
(a) Expression of Csf-1 and Csf-1r in different cell populations from PDG-GFP gliomas: mixed population of live cells (DAPI), purified glioma cells (GFP+) and macrophages (CD11b+Gr-1). Cd11b and Tv-a were used as cell type-specific control genes for macrophages and glioma cells respectively. Expression is depicted relative to the live cell fraction, normalized to Ubc for each sample (n = 3). (b) Representative immunofluorescence images of normal brain or PDG GBM co-stained with CSF-1R, CD68 (macrophages/microglia), and DAPI. Scale bar, 50 µm. (c) Graph showing the CSF-1R inhibitor BLZ945 blocked BMDM survival, with a comparable effect to CSF-1 deprivation, assessed by MTT assays; n = 13 independent replicates. (d) Graph showing MTT assays of BLZ945 treatment of independent PDGF-driven glioma cell (PDGC) primary lines derived from PDG mice (see also Supplementary Figs. 3d, 7c). Concentrations up to 6,700 nM BLZ945 (100× the dose required to effectively kill BMDMs in vitro) had no effect on glioma cell survival or proliferation, n = 3 independent replicates. (e) Experimental design for long-term survival trial: PDG mice were injected with RCAS-hPDGF-B-HA between 5–6 weeks of age to induce glioma formation, and randomly assigned to vehicle (20% captisol, n = 22) or BLZ945 (200 mg.kg–1, n = 14) treatment groups at 2.5 weeks post-injection. Mice were dosed once daily until they developed symptoms or reached the trial endpoint, and (f) symptom-free survival curves generated. (g) Vehicle and BLZ945 groups were graded histologically (n = 14, 13 respectively). Graphs show mean and s.e.m. in (a, c–d). P values were obtained using unpaired two-tailed Student’s t-test in (c–d), Log Rank (Mantel-Cox) test in (f), and Fisher’s exact test in (g). *P<0.05, ***P<0.001.
Figure 2
Figure 2. CSF-1R inhibition blocks tumor growth and effectively regresses established gliomas
(a) Experimental design for short-term 7d trial: PDG mice bearing detectable tumors by MRI were randomly assigned to vehicle or BLZ945 groups, with follow-up MRI as depicted. (b) Graph showing mean tumor volume over the time course for mice whose starting tumor volume was 4.5–40 mm3 (vehicle or BLZ945, n = 11 per group) or (c) > 40 mm3 (BLZ945 large, n = 18). (d) Representative images of T2-weighted MRI scans from the start and endpoint of the trial. Dashed line indicates region of interest used to calculate tumor volume. (e) Waterfall plots depicting change in tumor volume at endpoint relative to starting tumor volume for each individual mouse. Horizontal dashed lines indicate a 30% decrease in tumor volume. In the vehicle group, there was a progressive, substantial increase in tumor growth, ranging from 195–879%. By contrast, in this short treatment period, 6 of 18 mice in the BLZ945 large group had >30% reduction in tumor volume, qualifying as a partial response according to Response Evaluation Criteria in Solid Tumors (RECIST). Graphs show mean ± s.e.m. P values were obtained using unpaired two-tailed Student’s t-test; **P<0.01, ***P<0.001.
Figure 3
Figure 3. Short-term BLZ945 treatment results in reduced tumor grade and proliferation, and increased apoptosis
(a) Representative H&E images from 7d trial in the PDG model depicting grade IV/GBM (vehicle) and histological response (BLZ945). (b) Representative images from 3d and 7d timepoints stained for Olig2 (glioma cells), BrdU, cleaved caspase-3 (CC3), and DAPI. White arrows indicate rare BrdU+Olig2+ cells in BLZ945 groups. (c) Quantitation of total DAPI+ cells per tumor; (d) percentage of Olig2+ cells relative to total DAPI+ cells; (e) percentage of proliferating BrdU+Olig2+ cells relative to total DAPI+ cells; and (f) percentage of apoptotic CC3+ cells relative to total DAPI+ cells (n ≥ 5 per group). These analyses revealed a progressive reduction in cell number, and by 7d, average glioma cell density was reduced to ≤ 20% of total cells in both BLZ945 groups. Analysis of glioma cell proliferation revealed a 67–98% reduction following BLZ945 treatment. Circles represent individual mice and horizontal lines represent the mean. Scale bar, 50 µm. P values were obtained using unpaired two-tailed Student’s t-test; NS=not significant, *P<0.05, **P<0.01, ***P<0.001.
Figure 4
Figure 4. BLZ945 inhibits orthotopic tumor growth of patient-derived proneural tumor spheres and cell lines in vivo
(a) Graph shows assessment of CSF-1R mRNA expression in human proneural tumor sphere cells, TS573, and in the human proneural cell line, U251, compared to the human macrophage line THP-1 (positive control). Expression is normalized to β2M for each sample, n = 3 independent replicates. (b) Graph showing MTT assays of BLZ945 tested against TS573 and U251 human glioma cells, demonstrating no effect of BLZ945 concentrations up to 6,700 nM. n = 3 independent replicates. (c, d) Graphs showing relative tumor growth determined by bioluminescence imaging (BLI) output in NOD/SCID mice intracranially injected with (c) 5 × 10⁴ TS573 cells or (d) 2.5 × 10⁵ U251 cells. Treatment with BLZ945 was initiated when tumors were in a positive growth phase determined by BLI, which corresponded to d14 for TS573 and d7 for U251. Mice were randomly assigned to vehicle (n = 12 for TS573, n = 16 for U251) or BLZ945 (n = 11 for TS573, n = 17 for U251) treatment groups. Tumor growth was evaluated every 5d for 15d, at which point vehicle-treated mice became symptomatic and both cohorts were sacrificed for further analyses. (e, f) Representative images of vehicle-treated and BLZ945-treated (e) TS573 and (f) U251 xenograft tumors described in (c, d), stained for GFP (tumor cells) and DAPI. Representative H&E images of both treatment groups for U251 xenografts are shown in the lower panels. Scale bar, 50 µm. Graphs represent mean and s.e.m. P values were obtained using nonparametric two-tailed Mann Whitney test; *P<0.05, **P<0.01, ***P<0.001.
Figure 5
Figure 5. CSF-1R inhibition depletes normal microglia, but not TAMs in treated PDG gliomas due to the production of glioma-supplied survival factors
(a) Representative images of PDG gliomas (upper panel) and adjacent normal brain from the contralateral hemisphere of tumor-bearing mice (lower panel) from the 7d BLZ945 trial stained for CD68 and DAPI. (b) Graph showing quantitation of the mean number of CD11b+ macrophages per 63× field of view (FOV) within each mouse tumor at 7d. (c) Graph showing MTT assays of BMDMs, demonstrating that glioma cell-conditioned media (GCM) induced BMDM proliferation and protected BMDMs from BLZ945-induced apoptosis, n = 19 independent replicates. For comparison, BMDMs were cultured in non-conditioned media supplemented with CSF-1. (d) Results compiled from MTT assays demonstrating that GM-CSF and IFN-γ individually protected BMDMs against BLZ945-induced death (n = 9 independent replicates) while (e) CXCL10 promoted proliferation (n = 6 independent replicates). These effects were not reproduced by other candidate factors, e.g. CXCL1 and VEGF-A shown here and in Supplementary Fig. 17. (f) Western blots showing activation of Akt (Ser473 phosphorylation site) in BMDMs. BMDMs were stimulated with freshly prepared GCM from protective (PDGC-23, PDGC-17, PDGC-02) or non-protective (PDGC-55) cell lines +/− BLZ945. In addition, GCM from non-protective PDGC-55 cells was supplemented with survival factors (GM-CSF, IFN-γ and CXCL10) +/− BLZ945. (g) Graph showing quantitation of phosphorylated Akt (pAkt), normalized to total Akt, demonstrating significant changes in pAkt levels between BMDMs stimulated with the protective or non-protective GCM +/− BLZ945. n = 4 independent replicates. BLZ945 was used at 670 nM in all cell culture assays unless otherwise specified. Circles in graph (b) represent individual mice (n ≥ 5 per group), and horizontal lines represent the mean. Data in other graphs represent mean and s.e.m. P values were obtained using unpaired two-tailed Student’s t-test; NS = not significant, *P<0.05, **P<0.01, ***P<0.001. There were no significant differences for any comparisons in (b).
Figure 6
Figure 6. CSF-1R inhibition impairs heterotypic signaling between macrophages and glioma cells, and is predictive of improved survival in proneural GBM patients
(a) Volcano plot showing 257 differentially expressed genes in TAMs from BLZ945-treated mice compared to TAMs from vehicle controls (7d treatment, n = 8 each), termed the ‘total’ gene signature. 205 downregulated and 52 upregulated genes were differentially expressed in TAMs in the BLZ945 group. (b) Heatmap of the ‘minimal’ gene signature determined using a lasso logistic regression model trained on expression data in (a). This identified 5 genes, which when considered together, accurately differentiated between BLZ945 and vehicle groups. (c, d) Graph showing expression of M2-associated genes in cultured BMDMs, demonstrating an increase with exposure to GCM, that was blocked in the presence of BLZ945, as determined by (c) qPCR for a panel of M2-associated genes identified in the total gene signature (Supplementary Fig. 20f) or (d) flow cytometry for Mrc1, n = 7 independent replicates. (e) Graph showing glioma cell cycle analyses, in which glioma cells were co-cultured with either naïve-BMDMs or stimulated-BMDMs (i.e. treated with GCM prior to co-culture, as shown in Supplementary Fig. 15a). Co-cultures were treated with BLZ945 or vehicle, and subjected to flow cytometric analyses, n = 8 independent replicates. (f) Western blots showing pAkt (Ser473) and pErk (Thr202/Tyr204) levels in glioma cells at the time points indicated. Glioma cells were exposed to CM produced by naïve- or stimulated-BMDMs +/− BLZ945; see schematic in Supplementary Fig. 23a. BLZ945 was used at 670 nM in all cell culture assays unless otherwise specified. (g) TCGA proneural patients were classified into ‘BLZ945-like’ and ‘Vehicle-like’ classes using the minimal gene signature from (b) (see Supplementary Methods). Patients classified as ‘BLZ945-like’ showed increased median survival of 10 months. (h) Hazard ratios (HR) and 95% confidence intervals (CI) for the minimal gene signature were determined for each subtype of TCGA and Combined datasets: HRs with a CI that does not cross 1.0 are considered significant. Graphs show mean and s.e.m. P values were obtained using unpaired two-tailed Student’s t-test in (c–e), Log Rank test in (g), and Wald’s test in (h). *P<0.05, **P<0.01, ***P<0.001.

Comment in

References

    1. Stupp R, et al. Radiotherapy plus concomitant and adjuvant temozolomide for glioblastoma. N Engl J Med. 2005;352:987–996. - PubMed
    1. Wen PY, Kesari S. Malignant gliomas in adults. N Engl J Med. 2008;359:492–507. - PubMed
    1. Dunn GP, et al. Emerging insights into the molecular and cellular basis of glioblastoma. Genes Dev. 2012;26:756–784. - PMC - PubMed
    1. Verhaak RG, et al. Integrated genomic analysis identifies clinically relevant subtypes of glioblastoma characterized by abnormalities in PDGFRA, IDH1, EGFR, and NF1. Cancer Cell. 2010;17:98–110. - PMC - PubMed
    1. Balkwill FR, Mantovani A. Cancer-related inflammation: Common themes and therapeutic opportunities. Semin Cancer Biol. 2012;22:33–40. - PubMed

Publication types

Substances