Review
. 2013 Nov 7;5(21):10127-40.
doi: 10.1039/c3nr03633b. Epub 2013 Sep 20.

Plasmonic nanoprobes: from chemical sensing to medical diagnostics and therapy

Affiliations
Review

Plasmonic nanoprobes: from chemical sensing to medical diagnostics and therapy

Tuan Vo-Dinh et al. Nanoscale. .

Abstract

This article provides an overview of the development and applications of plasmonics-active nanoprobes in our laboratory for chemical sensing, medical diagnostics and therapy. Molecular Sentinel nanoprobes provide a unique tool for DNA/RNA biomarker detection both in a homogeneous solution or on a chip platform for medical diagnostics. The possibility of combining spectral selectivity and high sensitivity of the surface-enhanced Raman scattering (SERS) process with the inherent molecular specificity of nanoprobes provides an important multiplex diagnostic modality. Gold nanostars can provide an excellent multi-modality platform, combining two-photon luminescence with photothermal therapy as well as Raman imaging with photodynamic therapy. Several examples of optical detection using SERS and photonics-based treatments are presented to illustrate the usefulness and potential of the plasmonic nanoprobes for theranostics, which seamlessly combines diagnostics and therapy.


Figures

Figure 1
Figure 1
SERS-active plasmonic platforms (A) Nanowave platform consisting of nanosphere arrays coated with metal film [Adapted from Ref. 4]; (B) Top Left: Schematic of gold-coated silicon-germanium nanowires with a diamond-shaped structure, epitaxially grown from silicon nanowires; Top Right: Scanning electron microscopy (SEM) image of 2D gold-coated silicon-germanium nanowires formed on silicon-on-insulato ; Bottom Left: Transmission electron microscopy (TEM) cross-section image showing atomic layer deposition of platinum (black color) on the diamond-shaped nanowires (dark grey color) [Adapted from ref. 55] (C)Metal film on nanorod arrays fabricated using nanolithography and plasma etching [Adapted from Ref. 12] (D) SERS-active pH nanosensors for single-cell analysis [Adapted from Ref. 56]
Figure 2
Figure 2
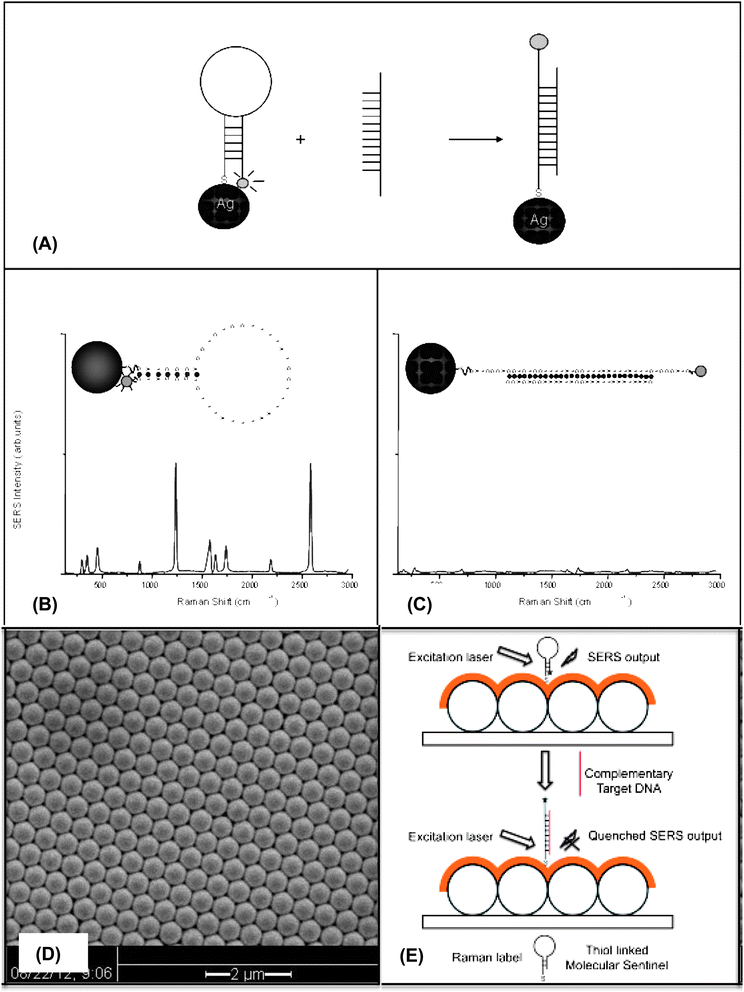
(A) Operating Principle of a SERS Molecular Sentinel (MS) Nanoprobe. . (Adapted from reference 30) (B) A SERS signal is observed when the MS probe is in the stem-loop conformation with the label close to the nanoparticle, inducing a strong SERS signal (closed-state), (C) Following hybridization with a target probe, the stem opens and separates the label from the nanoparticle causing the SERS signal to decrease (D) Application of the label-free MS detection scheme on Nanowave chip (E) SEM image of Nanowave chip substrate. In this substrate, a monolayer of 520-nm diameter polystyrene beads is covered by a 200-nm thick Au layer. (Adapted from reference 50)
Figure 3
Figure 3
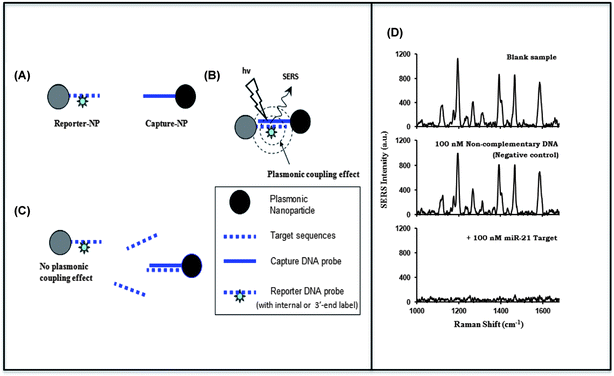
The Plasmonic Coupling Interference (PCI) Detection Scheme. (A) Silver nanoparticles are functionalized with thiolated capture oligonucleotides (Capture-NP) or complementary DNA probes labeled with a Raman dye (Reporter-NP). (B) Plasmonic coupling effect between adjacent nanoparticles is induced by the formation of capture/reporter complementary base-paired duplexes, which couple Capture-NPs and Reporter-NPs in a short separation distance. (C) The plasmonic coupling effect is interfered with by the formation of target/reporter duplexes. (D) MicroRNA detection using the PCI Technique. Upper spectrum: positive control (blank) sample containing a mixture of capture-(miR21)-NPs and reporter-(miR21)-NPs. Middle spectrum: in the presence of non-complementary DNA sample as the negative control test. Lower spectrum: in the presence of complementary miR-21 targets (adapted from Ref. 47).
Figure 4
Figure 4
(Top) TEM images of nanostars having different numbers of branches: S10 (10 branches), S20 (20 branches) and S30 (30 branches). The scale bar is 50 nm. (Bottom) Simulation of |E| in the vicinity of the nanostars in response to a z-polarized plane wave incident E-field of unit amplitude, propagating in the y-direction, and with a wavelength of 800 nm. E-field enhancement is greatest on S20. The insets depict the 3D geometry of the stars. Diagrams are not to scale. (Adapted from Ref.48)
Figure 5
Figure 5
Calibration curve showing SERS intensity for the NIR dye, DTTC, on gold nanostars coated with silica monitored using peak at 507 cm−1 over a range of concentrations from 0 to 0.125 nM. The spectra were measured using the 785-nm laser at 230 mW. Inset: Full spectrum of 0.125 nM DTTC-nanostar in solution
Figure 6
Figure 6
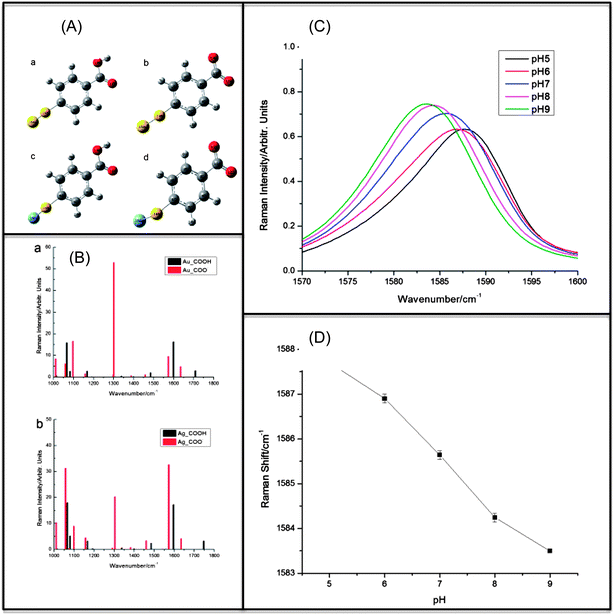
SERS Nanoprobe for pH Monitoring (Adapted form Ref. 61) (A) Molecular models for DFT calculations. a. pMBA-Au complex under the protonated state (Au_COOH). b. pMBA-Au complex under the deprotonated state (Au_COO). c. pMBA-Ag complex under the protonated state (Ag_COOH). d. pMBA-Ag complex under the deprotonated state (Ag_COO). (B) Calculated Raman peaks for pMBA-Au and pMBA-Ag complexes at the protonated (black) and deprotonated (red) states. (C) pH dependence of SERS spectra (1570 cm−1-1600 cm−1): Detail of the spectroscopic range for monitoring pH. (D) SERS peak position as a function of pH.
Figure 7
Figure 7
TAT-functionalized gold nanostars. (A) Synthetic schematics for TAT peptide functionalization on nanostars. Bare nanostar was coated with thiolated-PEG then with cysteine-terminated TAT. (B) Cellular uptake of 0.1 nM bare nanostars, PEG-nanostars, and TAT-nanostars incubated 24 hours on BT549 cells. Aggregated bare nanostars correspond to the white big punctates on TPL image. PEG-nanostars showed very minimal uptake. Endosomal and cytosolic TAT-nanostars corresponds to the diffuse white pattern on TPL image. Nanostars are white and nuclei are stained blue. TPL image size: 125×125 μm2. (Adapted from Ref. 41)
Figure 8
Figure 8
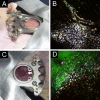
Photographs and multiphoton microscopy images 48 hours after nanostars injection before (top) and after (bottom) the irradiation. (A) Before the irradiation, the window appeared intact; (B) Nanostars (white color) extravasated into the tissue and near the perivascular space; Green color from FITC-dextran delineates the blood vessels; (C) After the laser irradiation (785 nm 1.1 W/cm2, 10 min), a localized hemorrhage was formed (white arrow); (D) Leakage of FITC-dextran into the tissue was apparent in the irradiated spot but not outside the hemorrhagic spot. Microscope images are 508×□08 μm2. (Adapted from Ref. 40)
Figure 9
Figure 9
(A) Overview of the proof-of-concept theranostic construct. Upon excitation at 785 nm, SERS is observed from the NIR Raman dye on the nanostar surface. Excitation at 633 nm generates fluorescence (and singlet oxygen) from the MB embedded within the silica shell. (B) shows effective PDT on breast cancer cells after incubation with MB-loaded particles and light exposure. In (C), the same light exposure was performed on cells treated with silica-coated nanostars that did not contain MB, showing no evidence of any photothermal effects. Figure adapted from [39].
Figure 10
Figure 10
Two photon luminescence imaging (A, D), Raman imaging (B, E) and cell viability after photodynamic therapy (C, F) of the theranostic nanoconstruct functionalized with (D-F) and without (A-C) the TAT peptide. Raman images were created by taking 5s acquisitions at each point (2 μm step size) over the selected area and integrating the intensity of a SERS peak from the labeled nanoparticles. For PDT, the photosensitizer was activated by exposure to UV light (30s, 4.4 W cm−2). Cell viability staining was performed to visualize the effective cell destruction. Scale bars in A and D are 1 μm, the scale in B and E are the same, and the scale bars in C and F are 250 μm. Figure adapted from Ref .

Similar articles

Cited by

References

    1. Jeanmaire DL, Van Duyne RP. J. Electroanal. Chem. 1977;84:1–20.
    1. Albrecht MG, Creighton JA. J. Am. Chem. Soc. 1977;99:5215–5217.
    1. Moskovits M. Rev. Mod. Phys. 1985;57:783–826.
    1. Wokaun A, Gordon JP, Liao PF. Phys. Rev. Lett. 1982;48:957–960.
    1. Schatz GC. Acc. Chem. Res. 1984;17:370–376.

Publication types