. 2013 Nov;9(11):2785-97.
doi: 10.1039/c3mb70196d.

Salivary proteins associated with hyperglycemia in diabetes: a proteomic analysis

Affiliations

Salivary proteins associated with hyperglycemia in diabetes: a proteomic analysis

Sompop Bencharit et al. Mol Biosyst. 2013 Nov.

Abstract

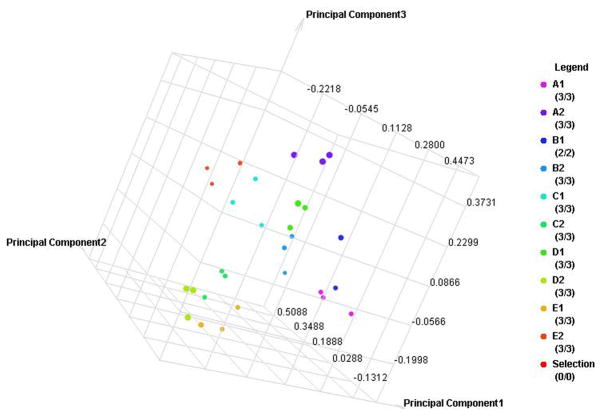
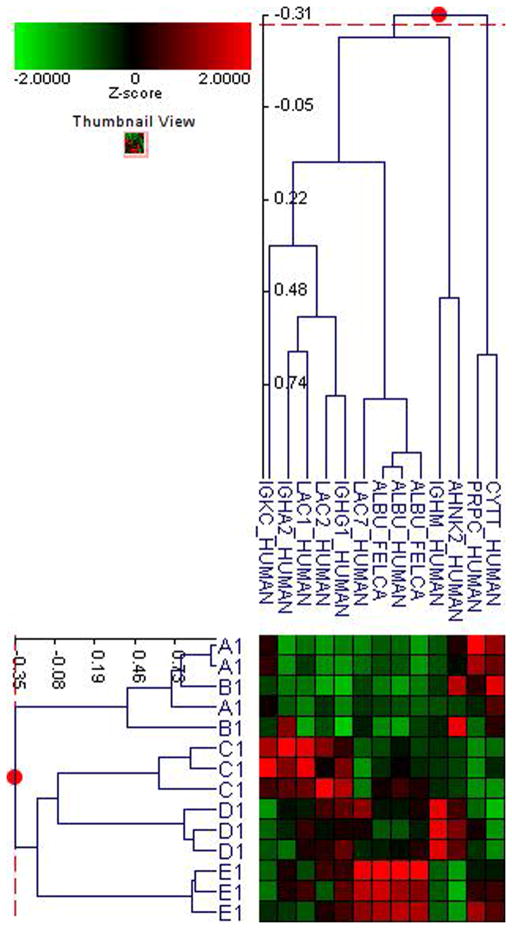
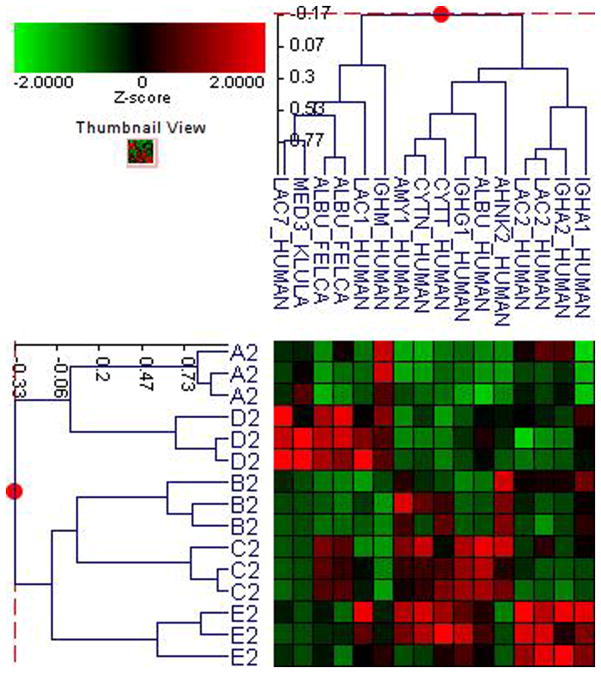
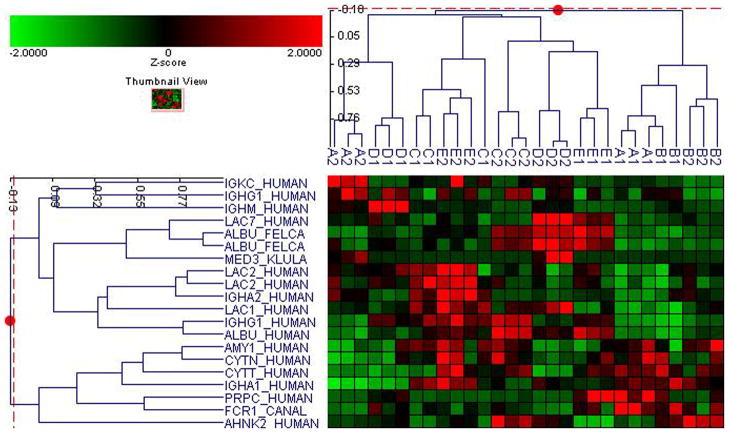
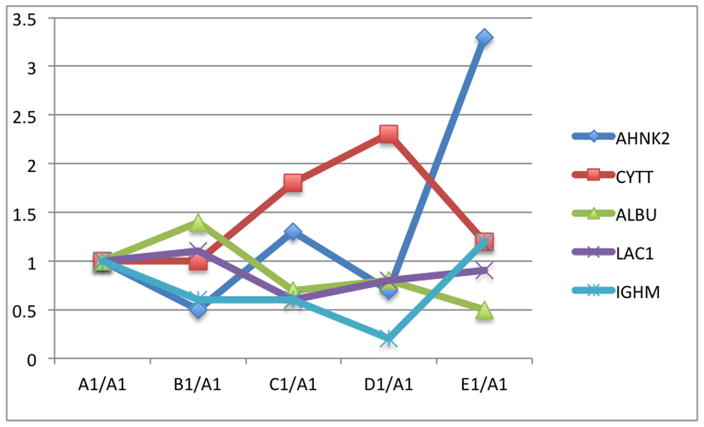
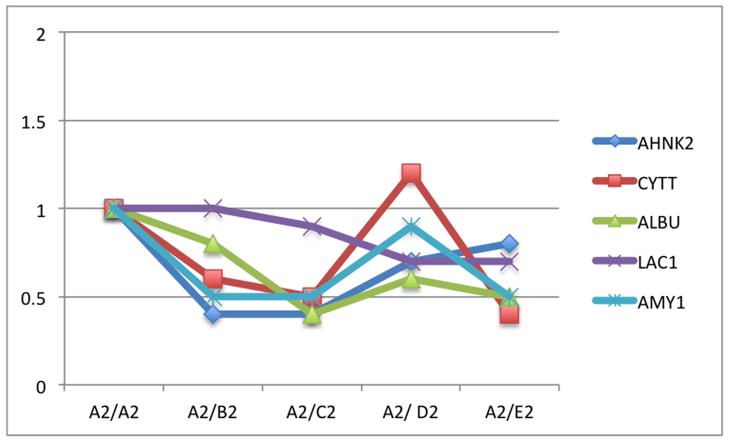
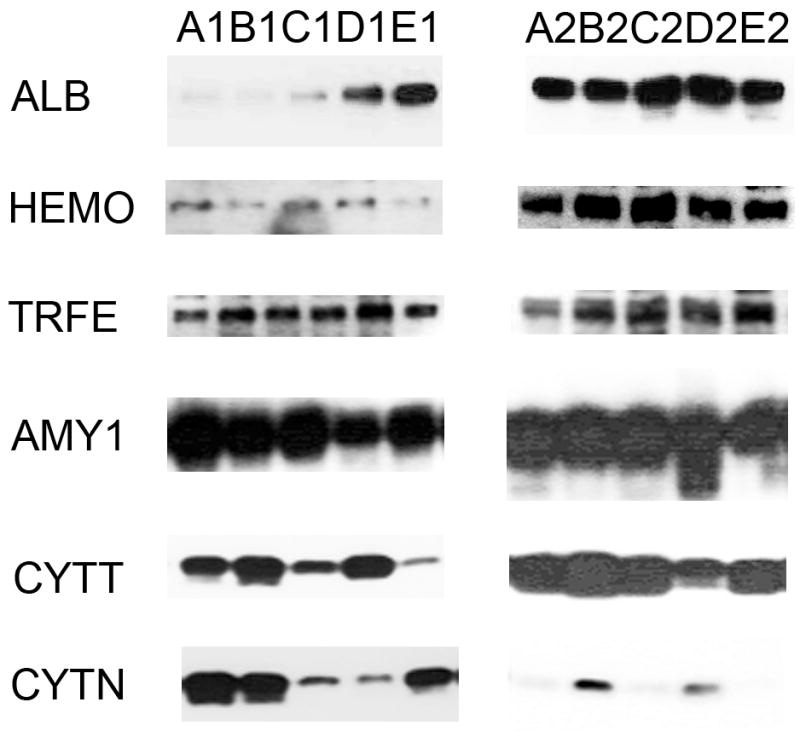
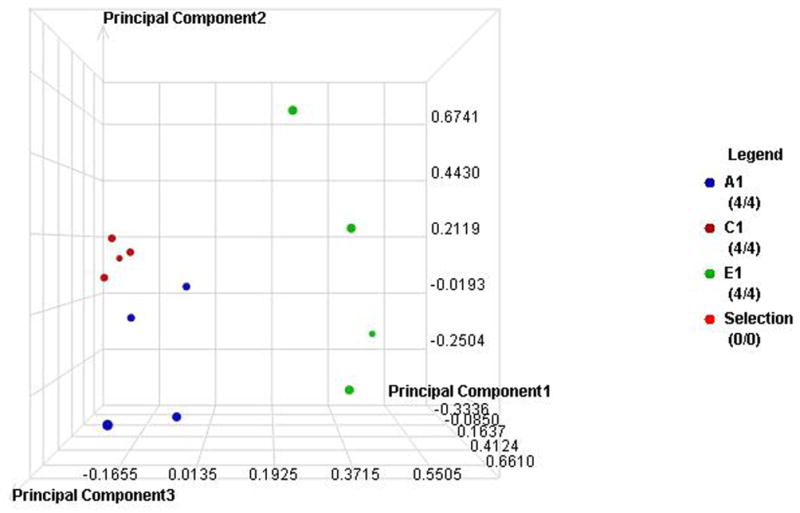
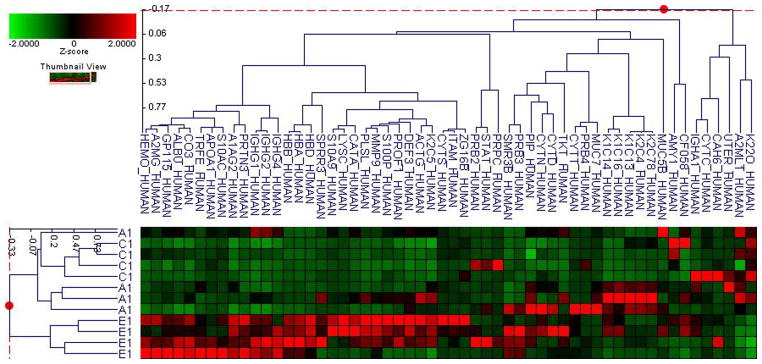
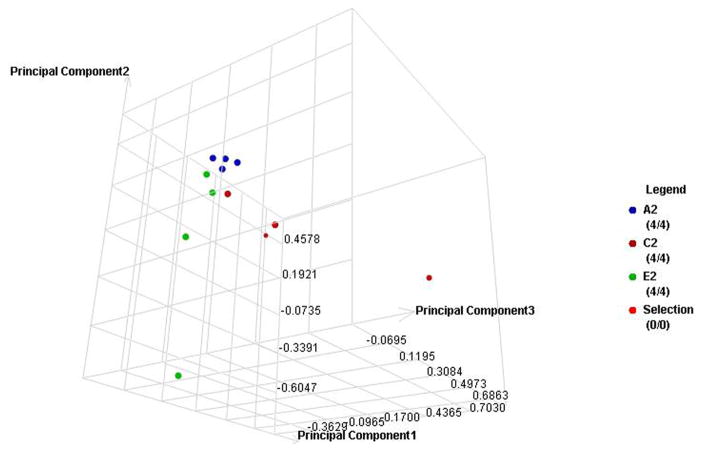
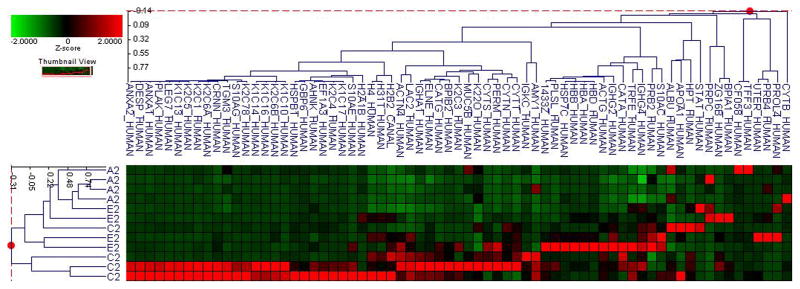
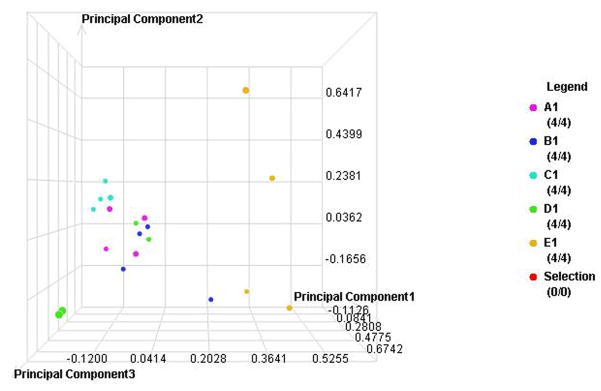
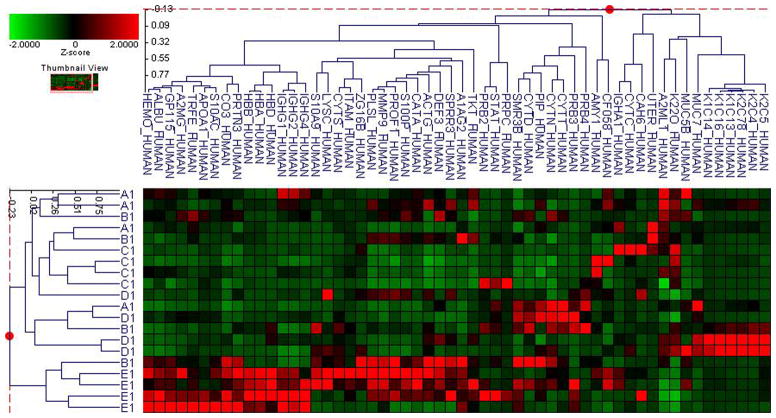
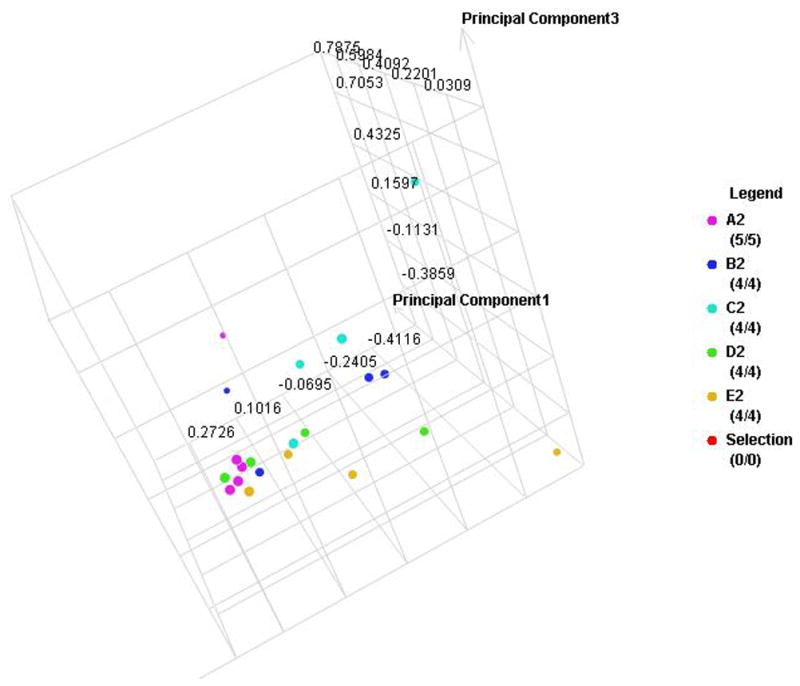
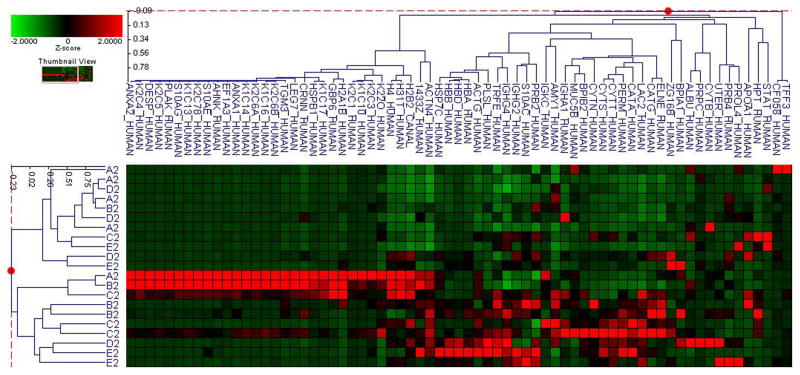
Effective monitoring of glucose levels is necessary for patients to achieve greater control over their diabetes. However, only about a quarter of subjects with diabetes who requires close serum glucose monitoring, regularly check their serum glucose daily. One of the potential barriers to patient compliance is the blood sampling requirement. Saliva and its protein contents can be altered in subjects with diabetes, possibly due to changes in glycemic control. We propose here that salivary proteomes of subjects with diabetes may be different based on their glycemic control as reflected in A1C levels. A total of 153 subjects with type 1 or 2 diabetes were recruited. Subjects in each type of diabetes were divided into 5 groups based on their A1C levels; <7, 7-8, 8-9, 9-10, >10. To examine the global proteomic changes associated with A1C, the proteomic profiling of pooled saliva samples from each group was created using label-free quantitative proteomics. Similar proteomic analysis for individual subjects (N=4, for each group) were then applied to examine proteins that may be less abundant in pooled samples. Principle component analysis (PCA) and cluster analysis (p<0.01 and p<0.001) were used to define the proteomic differences. We, therefore, defined the salivary proteomic changes associated with A1C changes. This study demonstrates that differences exist between salivary proteomic profiles in subjects with diabetes based on the A1C levels.


Conflict of interest statement

Conflict of Interest

The authors declare no financial conflict of interest.

Figures

Figure 1
Figure 1. Pooled sample proteomic analysis
A. Principle component analysis (PCA) of the proteomes from pooled saliva samples demonstrates differentially expressed peptides for each type of diabetes in each A1C group (A–E refer to levels of A1C <7, 7–8, 8–9, 9–10 and 1 for type 1 and 2 for type 2 diabetes). B. Cluster analysis of type 1 diabetes demostrates differential expression of proteins based on ANOVA (p<0.05). C. Cluster analysis of type 2 diabetes demostrates differential expression of proteins based on ANOVA (p<0.05). D. Cluster analysis of both type 1 and 2 diabetes demostrates differential expression of proteins based on ANOVA (p<0.05).
Figure 2
Figure 2
The relative levels of expression of certain proteins in pooled saliva samples showing a comparison of the relative levels of expression of serum albumin precursor, cystatin-SA, immunoglobulin fragments, and protein AHNK2 with the increased A1C levels (A–E). The levels of expression were calibrated using the level of expression of the group with lowest A1C (A1 or A2). The graphs were plotted using the log expression level of each group divided by A1 for type 1 diabetes and A2 for type 2 diabetes. A. Relative expression levels of selected peptide masses in type 1 diabetes B. Relative expression levels of selected peptide masses in type 2 diabetes C. Western blot analyses
Figure 2
Figure 2
The relative levels of expression of certain proteins in pooled saliva samples showing a comparison of the relative levels of expression of serum albumin precursor, cystatin-SA, immunoglobulin fragments, and protein AHNK2 with the increased A1C levels (A–E). The levels of expression were calibrated using the level of expression of the group with lowest A1C (A1 or A2). The graphs were plotted using the log expression level of each group divided by A1 for type 1 diabetes and A2 for type 2 diabetes. A. Relative expression levels of selected peptide masses in type 1 diabetes B. Relative expression levels of selected peptide masses in type 2 diabetes C. Western blot analyses
Figure 3
Figure 3. Individual sample proteomic analysis of the low (A), medium (C) and high (E) A1C groups in each type of diabetes
A. PCA of the proteomes from individual samples with type 1 diabetes B. Cluster anlysis of type 1 diabetes C. PCA of the proteomes from individual samples with type 2 diabetes D. Cluster anlysis of type 2 diabetes
Figure 4
Figure 4. Individual sample proteomic analysis of five groups in each type of diabetes
A. PCA of the proteomes from individual samples with type 1 diabetes B. Cluster anlysis of type 1 diabetes C. PCA of the proteomes from individual samples with type 2 diabetes D. Cluster anlysis of type 2 diabetes

Similar articles

Cited by

References

    1. Gallagher EJ, Le Roith D, Bloomgarden Z. J Diabetes. 2009;1:9–17. - PubMed
    1. Goldstein DE, Little RR, Lorenz RA, Malone JI, Nathan D, Peterson CM, Sacks DB. Diabetes Care. 2004;27:1761–1773. - PubMed
    1. Harris MI. Diabetes Care. 2001;24:979–982. - PubMed
    1. Hempe JM, Gomez R, McCarter RJ, Jr, Chalew SA. J Diabetes Complications. 2002;16:313–320. - PubMed
    1. Nathan DM, Buse JB, Davidson MB, Ferrannini E, Holman RR, Sherwin R, Zinman B. Diabetologia. 2009;52:17–30. - PubMed

Publication types