

Genetic associations with expression for genes implicated in GWAS studies for atherosclerotic cardiovascular disease and blood phenotypes
- PMID: 24057673
- PMCID: PMC3900869
- DOI: 10.1093/hmg/ddt461
Genetic associations with expression for genes implicated in GWAS studies for atherosclerotic cardiovascular disease and blood phenotypes
Abstract
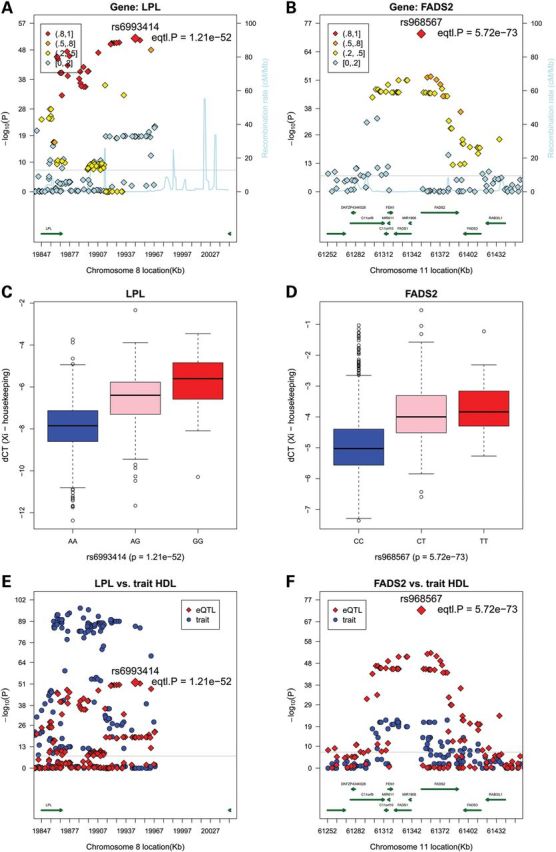
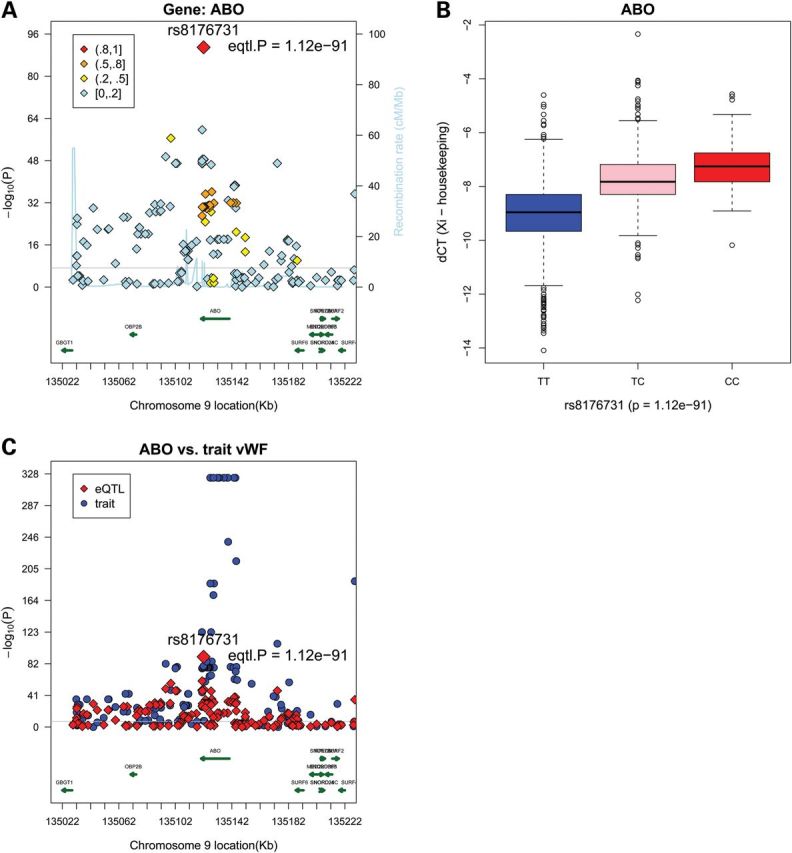
Genome-wide association studies (GWAS) have uncovered many genetic associations for cardiovascular disease (CVD). However, data are limited regarding causal genetic variants within implicated loci. We sought to identify regulatory variants (cis- and trans-eQTLs) affecting expression levels of 93 genes selected by their proximity to SNPs with significant associations in prior GWAS for CVD traits. Expression levels were measured by qRT-PCR in leukocytes from 1846 Framingham Heart Study participants. An additive genetic model was applied to 2.5 million imputed SNPs for each gene. Approximately 45% of genes (N = 38) harbored at least one cis-eSNP after a regional multiple-test adjustment. Applying a more rigorous significance threshold (P < 5 × 10(-8)), we found the expression level of 10 genes was significantly associated with more than one cis-eSNP. The top cis-eSNPs for 7 of these 10 genes exhibited moderate-to-strong association with ≥ 1 CVD clinical phenotypes. Several eSNPs or proxy SNPs (r(2) = 1) were replicated by other eQTL studies. After adjusting for the lead GWAS SNPs for the 10 genes, expression variances explained by top cis-eSNPs were attenuated markedly for LPL, FADS2 and C6orf184, suggesting a shared genetic basis for the GWAS and expression trait. A significant association between cis-eSNPs, gene expression and lipid levels was discovered for LPL and C6orf184. In conclusion, strong cis-acting variants are localized within nearly half of the GWAS loci studied, with particularly strong evidence for a regulatory role of the top GWAS SNP for expression of LPL, FADS2 and C6orf184.
Figures
Similar articles
-
Dissecting the genetics of the human transcriptome identifies novel trait-related trans-eQTLs and corroborates the regulatory relevance of non-protein coding loci†.Hum Mol Genet. 2015 Aug 15;24(16):4746-63. doi: 10.1093/hmg/ddv194. Epub 2015 May 27. Hum Mol Genet. 2015. PMID: 26019233 Free PMC article. Clinical Trial.
-
Integromic analysis of genetic variation and gene expression identifies networks for cardiovascular disease phenotypes.Circulation. 2015 Feb 10;131(6):536-49. doi: 10.1161/CIRCULATIONAHA.114.010696. Epub 2014 Dec 22. Circulation. 2015. PMID: 25533967 Free PMC article.
-
Endometrial vezatin and its association with endometriosis risk.Hum Reprod. 2016 May;31(5):999-1013. doi: 10.1093/humrep/dew047. Epub 2016 Mar 22. Hum Reprod. 2016. PMID: 27005890
-
Expression Quantitative Trait Loci Information Improves Predictive Modeling of Disease Relevance of Non-Coding Genetic Variation.PLoS One. 2015 Oct 16;10(10):e0140758. doi: 10.1371/journal.pone.0140758. eCollection 2015. PLoS One. 2015. PMID: 26474488 Free PMC article. Review.
-
From lipid locus to drug target through human genomics.Cardiovasc Res. 2018 Jul 15;114(9):1258-1270. doi: 10.1093/cvr/cvy120. Cardiovasc Res. 2018. PMID: 29800275 Review.
Cited by
-
Identification of SNPs and Candidate Genes Associated with Monocyte/Lymphocyte Ratio and Neutrophil/Lymphocyte Ratio in Duroc × Erhualian F2 Population.Int J Mol Sci. 2024 Sep 9;25(17):9745. doi: 10.3390/ijms25179745. Int J Mol Sci. 2024. PMID: 39273692 Free PMC article.
-
Molecular Quantitative Trait Locus Mapping in Human Complex Diseases.Curr Protoc. 2022 May;2(5):e426. doi: 10.1002/cpz1.426. Curr Protoc. 2022. PMID: 35587224 Free PMC article.
-
Genetic and environmental risk factors for atherosclerosis regulate transcription of phosphatase and actin regulating gene PHACTR1.Atherosclerosis. 2016 Jul;250:95-105. doi: 10.1016/j.atherosclerosis.2016.04.025. Epub 2016 May 2. Atherosclerosis. 2016. PMID: 27187934 Free PMC article.
-
Genome-wide discovery for biomarkers using quantile regression at biobank scale.Nat Commun. 2024 Jul 31;15(1):6460. doi: 10.1038/s41467-024-50726-x. Nat Commun. 2024. PMID: 39085219 Free PMC article.
-
How Gene Networks Can Uncover Novel CVD Players.Curr Cardiovasc Risk Rep. 2014 Jan;8:372. doi: 10.1007/s12170-013-0372-3. Curr Cardiovasc Risk Rep. 2014. PMID: 24683432 Free PMC article.
References
-
- Roger V.L., Go A.S., Lloyd-Jones D.M., Benjamin E.J., Berry J.D., Borden W.B., Bravata D.M., Dai S., Ford E.S., Fox C.S., et al. Executive summary: heart disease and stroke statistics – 2012 update: a report from the American heart association. Circulation. 2012;125:188–197. - PubMed
-
- Detrano R., Guerci A.D., Carr J.J., Bild D.E., Burke G., Folsom A.R., Liu K., Shea S., Szklo M., Bluemke D.A., et al. Coronary calcium as a predictor of coronary events in four racial or ethnic groups. N. Engl. J. Med. 2008;358:1336–1345. doi:10.1056/NEJMoa072100. - DOI - PubMed
-
- Polak J.F., Pencina M.J., Pencina K.M., O'Donnell C.J., Wolf P.A., D'Agostino R.B., Sr Carotid-wall intima–media thickness and cardiovascular events. N. Engl. J. Med. 2011;365:213–221. doi:10.1056/NEJMoa1012592. - DOI - PMC - PubMed
-
- Danesh J., Lewington S., Thompson S.G., Lowe G.D., Collins R., Kostis J.B., Wilson A.C., Folsom A.R., Wu K., Benderly M., et al. Plasma fibrinogen level and the risk of major cardiovascular diseases and nonvascular mortality: an individual participant meta-analysis. JAMA. 2005;294:1799–1809. doi:10.1001/jama.294.14.1799. - DOI - PubMed
-
- Smith A., Patterson C., Yarnell J., Rumley A., Ben-Shlomo Y., Lowe G. Which hemostatic markers add to the predictive value of conventional risk factors for coronary heart disease and ischemic stroke? The caerphilly study. Circulation. 2005;112:3080–3087. doi:10.1161/CIRCULATIONAHA.105.557132. - DOI - PubMed
Publication types
MeSH terms
Substances
Grants and funding
LinkOut - more resources
Full Text Sources
Other Literature Sources
Medical
