

The compression of deaths above the mode
- PMID: 24058281
- PMCID: PMC3779152
- DOI: 10.4054/DemRes.2010.22.17
The compression of deaths above the mode
Abstract
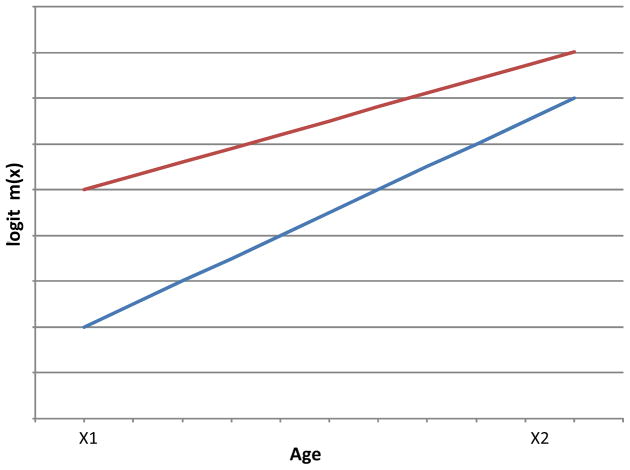
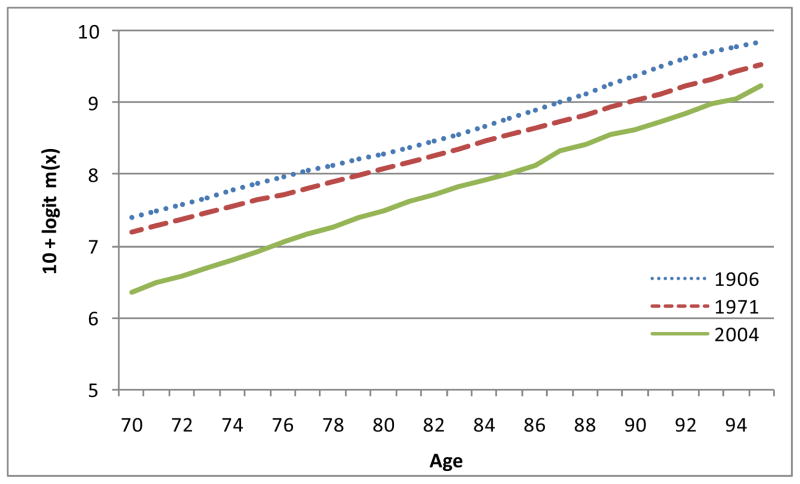
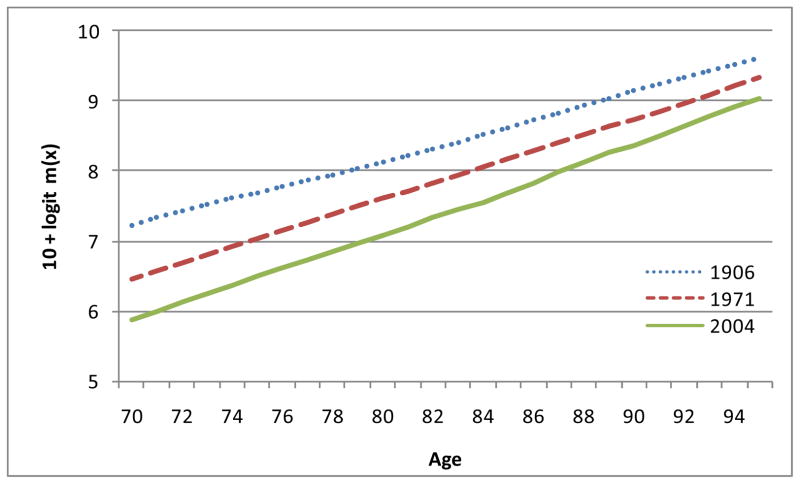
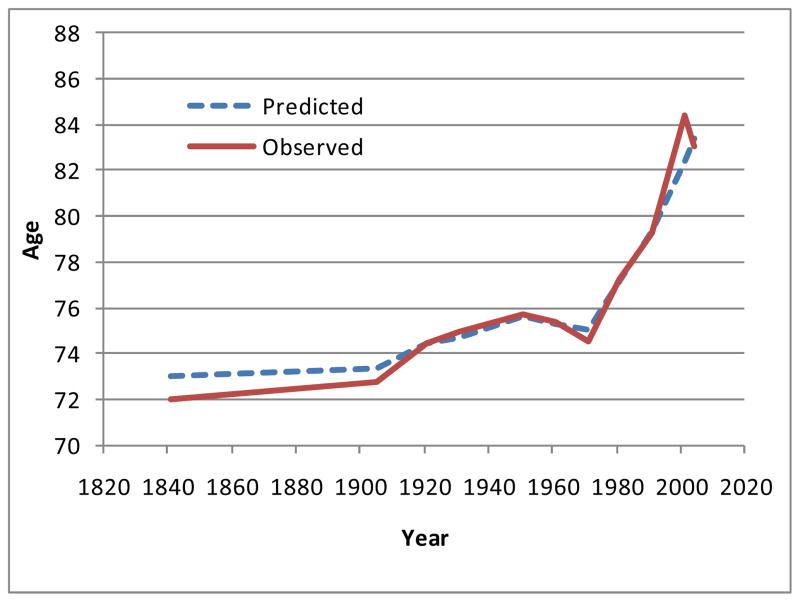
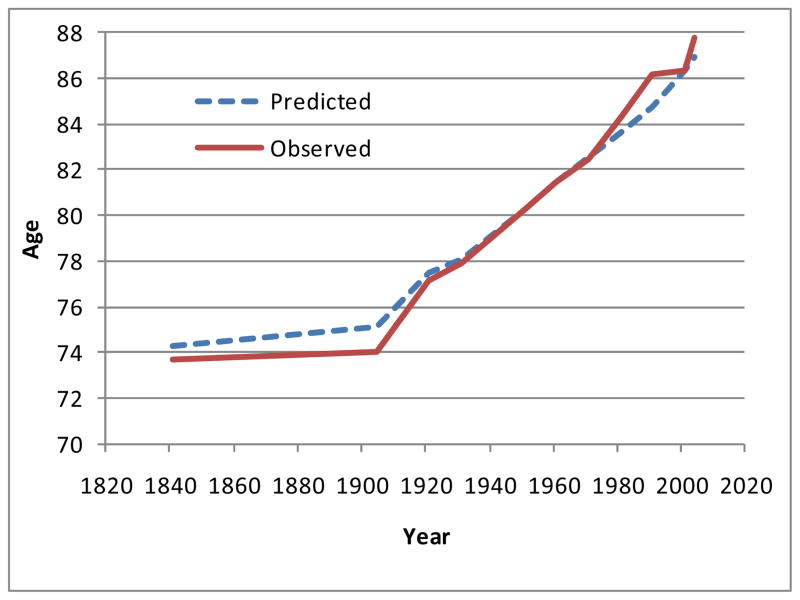
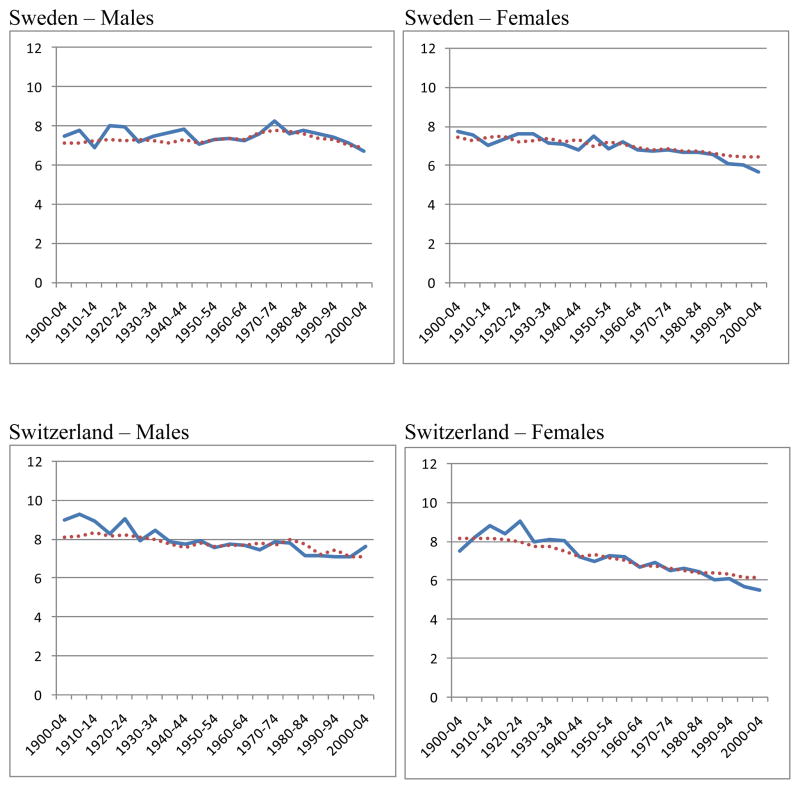
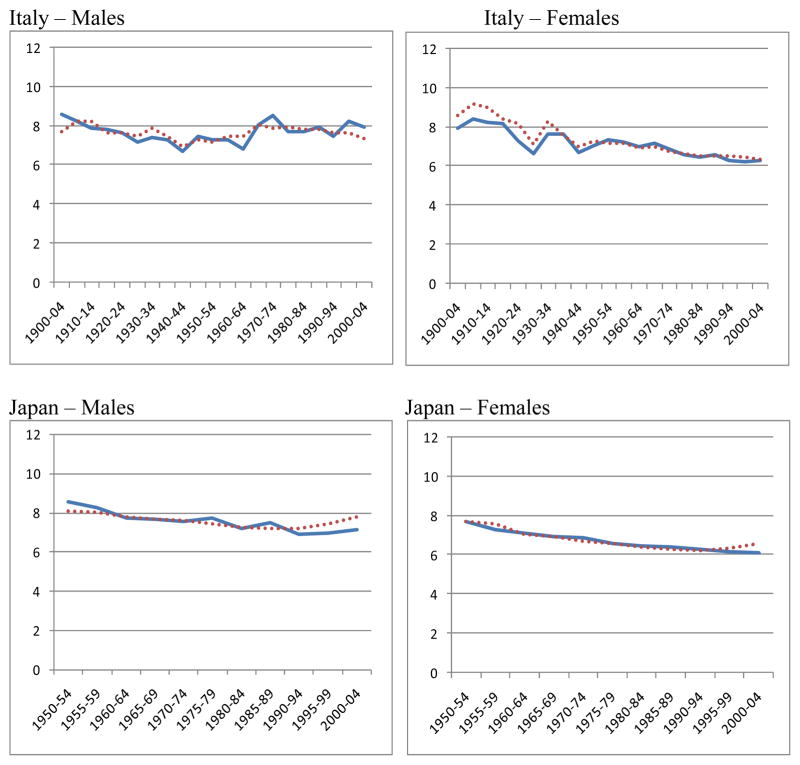
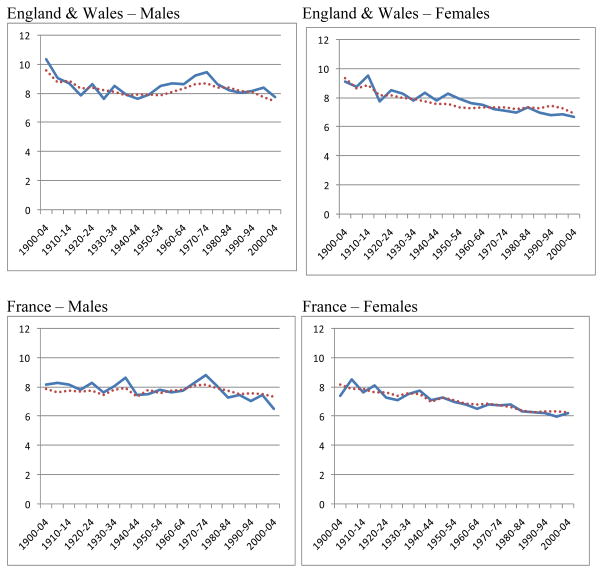
Kannisto (2001) has shown that as the frequency distribution of ages at death has shifted to the right, the age distribution of deaths above the modal age has become more compressed. In order to further investigate this old-age mortality compression, we adopt the simple logistic model with two parameters, which is known to fit data on old-age mortality well (Thatcher 1999). Based on the model, we show that three key measures of old-age mortality (the modal age of adult deaths, the life expectancy at the modal age, and the standard deviation of ages at death above the mode) can be estimated fairly accurately from death rates at only two suitably chosen high ages (70 and 90 in this study). The distribution of deaths above the modal age becomes compressed when the logits of death rates fall more at the lower age than at the higher age. Our analysis of mortality time series in six countries, using the logistic model, endorsed Kannisto's conclusion. Some possible reasons for the compression are discussed.
Figures
References
-
- Beard RE. Some aspects of theories of mortality, cause of death analysis, forecasting and stochastic processes. In: Brass W, editor. Biological Aspects of Demography. London: Taylor and Francis; 1971. pp. 57–68.
-
- Bongaarts J. Private communication between April 17–May 5 2008. 2008. Available on request from the authors; contact Siu Lan K. Cheung at cslk@hku.hk.
-
- Canudas-Romo V. The modal age at death and the shifting mortality hypothesis. Demographic Research. 2008;19(30):1179–1204. doi:10.4054/DemRes. 2008.19.30.
Grants and funding
LinkOut - more resources
Full Text Sources