. 2013 Aug 23;8(8):e71398.
doi: 10.1371/journal.pone.0071398. eCollection 2013.

Phototoxic action spectrum on a retinal pigment epithelium model of age-related macular degeneration exposed to sunlight normalized conditions

Affiliations

Phototoxic action spectrum on a retinal pigment epithelium model of age-related macular degeneration exposed to sunlight normalized conditions

Emilie Arnault et al. PLoS One. .

Abstract

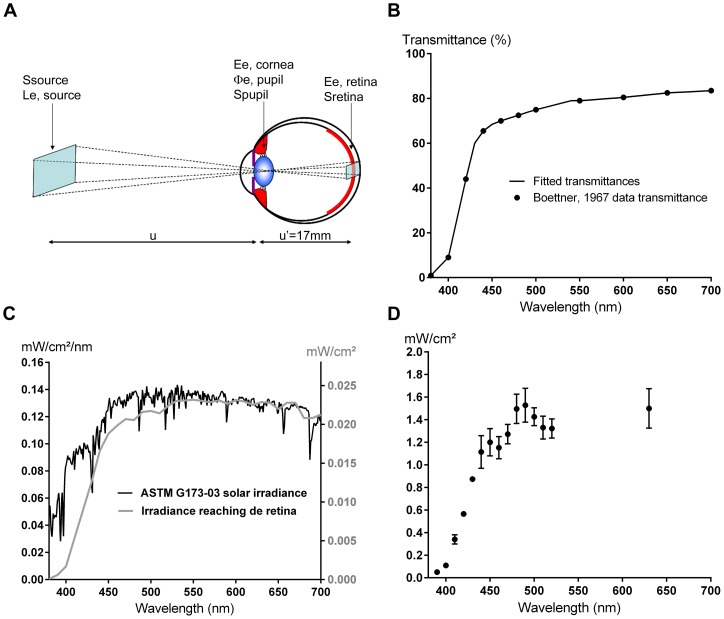
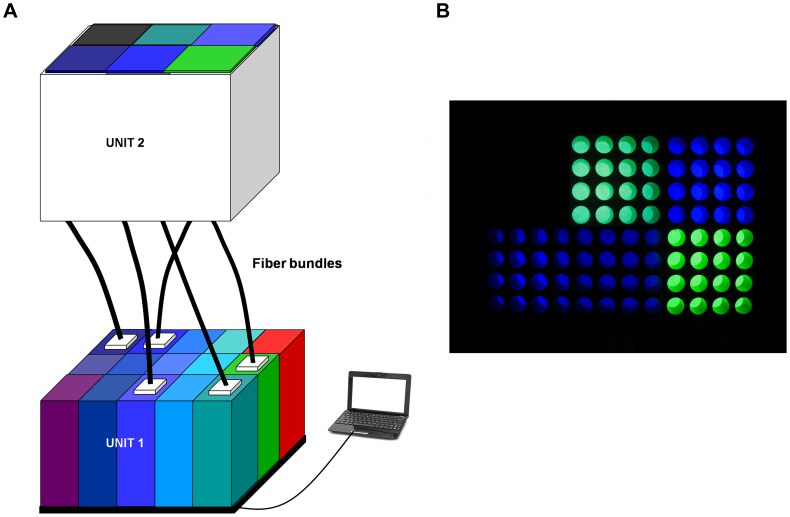
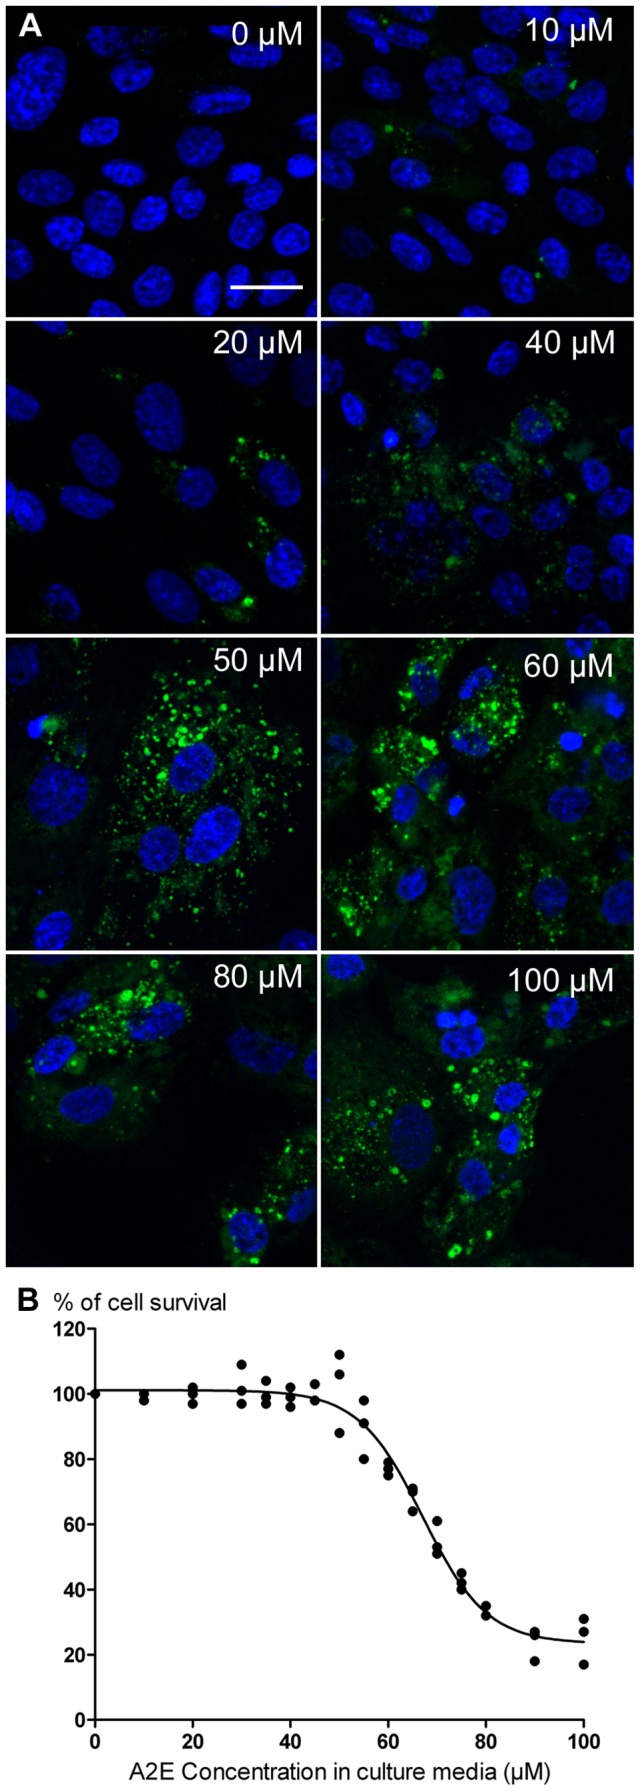
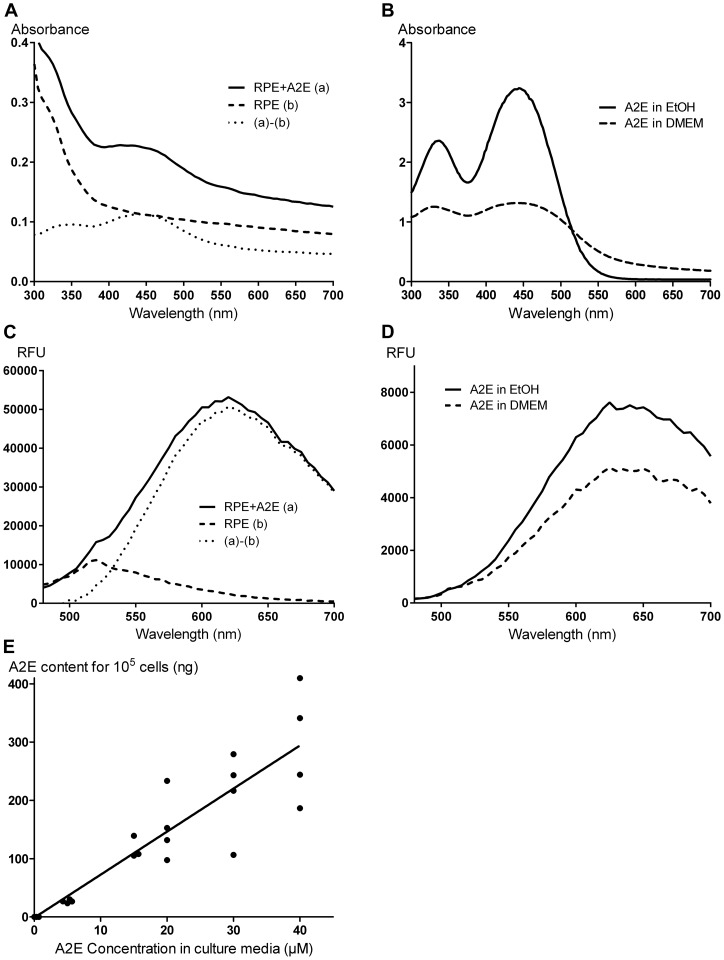
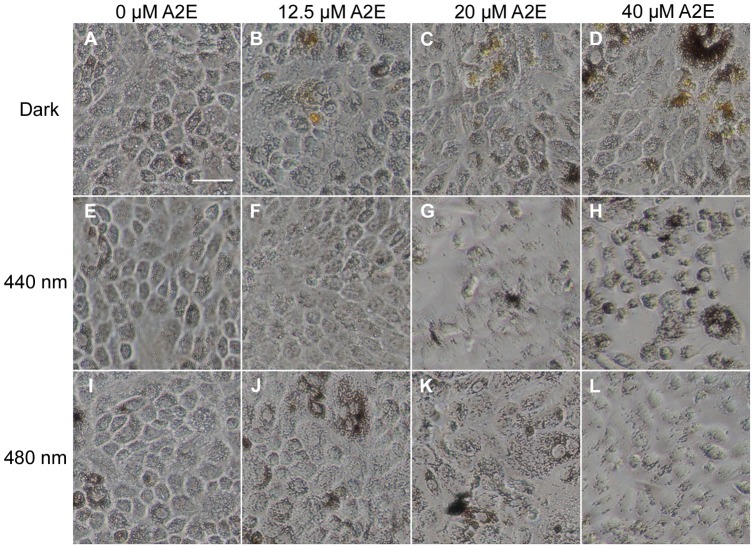
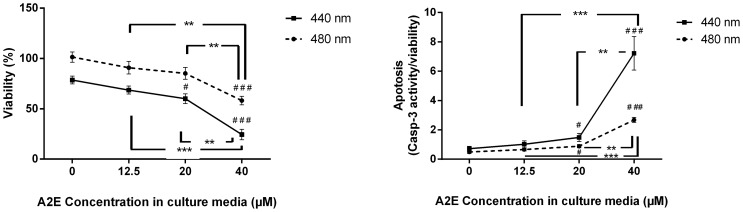
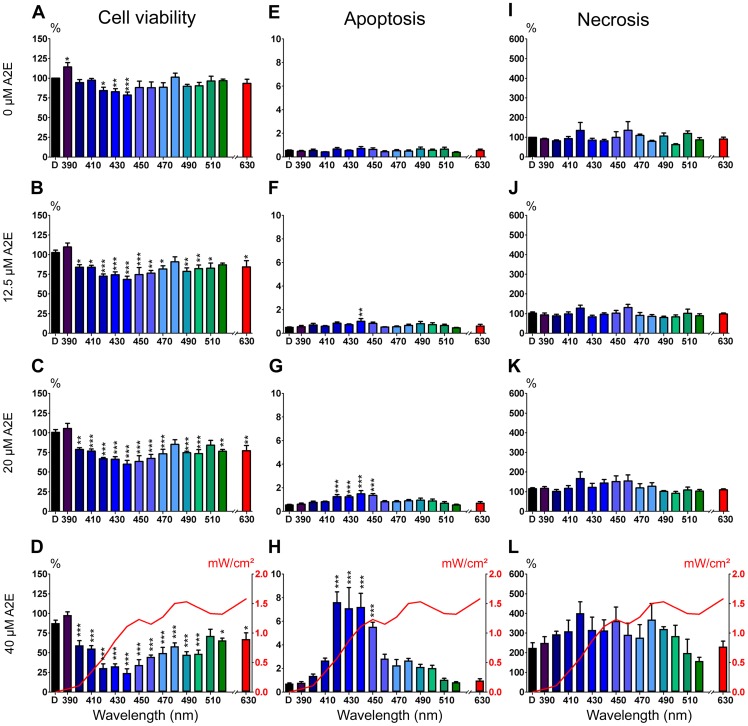
Among the identified risk factors of age-related macular degeneration, sunlight is known to induce cumulative damage to the retina. A photosensitive derivative of the visual pigment, N-retinylidene-N-retinylethanolamine (A2E), may be involved in this phototoxicity. The high energy visible light between 380 nm and 500 nm (blue light) is incriminated. Our aim was to define the most toxic wavelengths in the blue-green range on an in vitro model of the disease. Primary cultures of porcine retinal pigment epithelium cells were incubated for 6 hours with different A2E concentrations and exposed for 18 hours to 10 nm illumination bands centered from 380 to 520 nm in 10 nm increments. Light irradiances were normalized with respect to the natural sunlight reaching the retina. Six hours after light exposure, cell viability, necrosis and apoptosis were assessed using the Apotox-Glo Triplex™ assay. Retinal pigment epithelium cells incubated with A2E displayed fluorescent bodies within the cytoplasm. Their absorption and emission spectra were similar to those of A2E. Exposure to 10 nm illumination bands induced a loss in cell viability with a dose dependence upon A2E concentrations. Irrespective of A2E concentration, the loss of cell viability was maximal for wavelengths from 415 to 455 nm. Cell viability decrease was correlated to an increase in cell apoptosis indicated by caspase-3/7 activities in the same spectral range. No light-elicited necrosis was measured as compared to control cells maintained in darkness. Our results defined the precise spectrum of light retinal toxicity in physiological irradiance conditions on an in vitro model of age-related macular degeneration. Surprisingly, a narrow bandwidth in blue light generated the greatest phototoxic risk to retinal pigment epithelium cells. This phototoxic spectrum may be advantageously valued in designing selective photoprotection ophthalmic filters, without disrupting essential visual and non-visual functions of the eye.


Conflict of interest statement

Competing Interests: The authors have the following interests: 3 filed patents (“Optical device”, PCT/IB2012/057013, PCT/IB2012/057014 and PCT/IB2012/057015). CB, TV and DCT are employed by Essilor International (Charenton-le-Pont, France), one of the funders of this study. There are no further patents, products in development or marketed products to declare. This does not alter the authors' adherence to all the PLOS ONE policies on sharing data and materials, as detailed online in the guide for authors.

Figures

Figure 1
Figure 1. Sunlight irradiance reaching the retina.
A. Eye/light source model adapted from . The light source is described by its energetic radiance L e,λ,source(λ) (W/sr/m2) measured in the pupil direction and its emitting surface S source (m2). The source is assumed to be small compared to the distance u (m) between the source and the cornea. The cornea plane, the pupil plane and the nodal planes are assumed to be superimposed. The retina surface S retina illuminated by the light source is proportional to the surface of the source S source. B. Percent transmittance reaching the retina fitted from . C. ASTM G173-03 solar spectral irradiance (black curve, left axis) and sunlight irradiances reaching the retina (grey curve, right axis). The energetic irradiances reaching the retina were calculated by applying the ocular media filtering onto the referenced solar spectrum. D. Irradiances at well-plate level. The light exposure conditions were obtained by applying a multiplying coefficient to the calculated retinal irradiances. Values are expressed as mean ± s.e.m (n = 4 to 6).
Figure 2
Figure 2. Light emitting device.
A. The LED-based fibered illumination device is composed of two optical units and of a software control. Unit 1 generates fifteen 10 nm bandwidth illumination channels. Fourteen bands are equally distributed within the blue-green range in 10 nm increments with the first band centered at 390 nm and going up to 520 nm. An additional band is set at 630 nm in the red spectral range. The energetic irradiance delivered by each illumination channel is monitored by computer. Unit 2 is located in the cell incubator and ensures the light uniformity on cells. The two optical units are linked by five independent systems of fiber bundles providing light to five 16-well subdivisions of the 96-well plate. B. Representative 96-well plate illumination. Five 16-well subdivisions are simultaneously illuminated with distinct illumination bands while a 16-well subdivision is maintained in darkness.
Figure 3
Figure 3. Accumulation and toxicity of A2E in RPE cells.
A. Confocal imaging of A2E accumulation in RPE cells at various A2E concentrations in the culture medium. Individual cells can be detected by their cell nuclei (blue DAPI staining) while A2E incubation is associated with the apparition of autofluorescent dots (green) in RPE cells. Note the gradual increase in A2E autofluorescence in RPE cells with the increase in A2E concentrations applied in the incubation medium for 6 hours. B. Dose response curve of A2E toxicity on RPE cells. Cell survival was quantified with the CellTiter-Glo® assay 24 hours after the 6 hour A2E incubation. A loss of cell survival was detected at A2E concentrations over 45 µM with an IC50 at 67.5 µM. (n = 3, r2 = 0.9727). Scale bar represents 20 µm.
Figure 4
Figure 4. Characterization of the autofluorescence in A2E-loaded RPE cells.
A. Absorbance of RPE cells treated with 40 µM A2E (A2E+RPE (a), solid line) or A2E-untreated (RPE (b), dashed line). The curve ((a)–(b), dot line) representing the difference of absorption spectra between A2E-loaded RPE cells (a) and A2E-untreated RPE cells (b), shows absorption peaks at 335 nm and 440 nm. B. Absorbance spectra of free A2E in pure ethanol (solid line) or in modified DMEM (dashed line). Spectra are similar in both media and A2E displays maxima of absorbance at 335 nm and 440 nm. C. Emission spectra of RPE cells treated with 40 µM of A2E (A2E+RPE (a), solid line) or untreated (RPE (b), dashed line) under a 440 nm excitation. The curve ((a)–(b), dot line) representing the difference between the emission spectra in A2E-loaded RPE cells (a) and A2E-untreated RPE cells (b) shows a peak at 620 nm. D. Emission spectra of free A2E in pure ethanol (solid line) or in modified DMEM (dashed line) with a 440 nm excitation. Spectra are similar in both media and A2E displays a maximum of emission at 640 nm. E. A2E contents quantified by UPLC in RPE cells after 6 hours of incubation in various A2E concentrations (0, 5, 15, 20, 30 and 40 µM) in culture medium. The A2E content in RPE cells increases in a linear way according to the incubated A2E concentration. (n = 4, r2 = 0.9955). (RFU: Relative fluorescence unit).
Figure 5
Figure 5. Light-induced morphological changes in A2E-loaded RPE cells.
Images of RPE cells were obtained 6 hours after 18 hour light exposure with a 10 nm illumination band centered at 440 nm (E–H), at 480 nm (I–L) or maintained in darkness (A–D). RPE cells were incubated with A2E at 0 µM (A, E, I), 12.5 µM (B, F, J), 20 µM (C, G, K) or 40 µM (D, H, L). Note the yellow tint of A2E-loaded RPE cells maintained in darkness (B–D). RPE cells treated with A2E at 20 µM (G) or 40 µM (H) became round and lost their confluence after their exposure to a 10 nm band centered at 440 nm. By contrast, A2E-loaded RPE cells appeared healthy after their exposure to a 10 nm band centered at 480 nm (J–L) similarly as cells maintained in darkness (B–D) or A2E-untreated (A, I). Scale bar in A represents 20 µm.
Figure 6
Figure 6. A2E dose response curves of the A2E-elicited phototoxicity on RPE cells.
Cell viability (A) and cell apoptosis (B) were quantified with the ApoTox-Glo™ assay according to the A2E concentrations (0, 12.5, 20 and 40 µM) for RPE cells exposed to the 10 nm illumination bands centered at 440 or 480 nm. Cell viability and apoptosis were normalized with the experimental value obtained for RPE cells maintained in darkness without A2E treatment. The P-value was calculated using t-test. For the two illumination bands, statistically significant differences are indicated with respect to the illuminated conditions but in the absence of A2E (#p<0.05, ##p<0.01, ###p<0.001) and when considering two A2E concentrations (*p<0.05, **p<0.01, ***p<0.001).
Figure 7
Figure 7. Phototoxic action spectrum on A2E-loaded RPE cells.
(A–D) Histograms of cell viability according to the 10 nm illumination bands centered from 390 nm to 520 nm and at 630 nm for A2E-untreated RPE cells (0 µM, A) or A2E-loaded RPE cells (A2E concentrations:12.5 µM, B; 20 µM, C; or 40 µM, D). Viability levels were normalized with respect to the fluorescent signal measured in dark-maintained A2E-untreated cells (left vertical axis). (E–H) Histograms of cell apoptosis according to the 10 nm illumination bands centered from 390 nm to 520 nm and at 630 nm for A2E-untreated RPE cells (0 µM, E) and A2E-loaded RPE cells (A2E concentrations: 12.5 µM, F; 20 µM, G; or 40 µM, H). Apoptosis is expressed as the ratio of the caspase-3/7 activity luminescent signal reported to the cell viability fluorescent signal. (I–L) Histograms of cell necrosis according to the 10 nm illumination bands centered from 390 nm to 520 nm and at 630 nm for A2E-untreated RPE cells (0 µM, I) or A2E-loaded RPE cells (A2E concentrations: 12.5 µM, J; 20 µM, K; or 40 µM, L). Necrosis levels are normalized to the fluorescent signal measured in dark-maintained A2E-untreated RPE cells. Each 10 nm illumination band is designated on the graphs by its central wavelength. The red curves in D, H and L represent the mean light irradiances (right vertical axis) for each 10 nm illumination band. Statistically significant differences as compared to A2E-untreated cells maintained in darkness (*p<0.05; **p<0.01; ***p<0.001).

References

    1. Congdon N, O'Colmain B, Klaver CC, Klein R, Munoz B, et al. (2004) Causes and prevalence of visual impairment among adults in the United States. Arch Ophthalmol 122: 477–485. - PubMed
    1. Friedman DS, O'Colmain BJ, Munoz B, Tomany SC, McCarty C, et al. (2004) Prevalence of age-related macular degeneration in the United States. Arch Ophthalmol 122: 564–572. - PubMed
    1. Rein DB, Wittenborn JS, Zhang X, Honeycutt AA, Lesesne SB, et al. (2009) Forecasting age-related macular degeneration through the year 2050: the potential impact of new treatments. Arch Ophthalmol 127: 533–540. - PubMed
    1. Smith W, Assink J, Klein R, Mitchell P, Klaver CC, et al. (2001) Risk factors for age-related macular degeneration: Pooled findings from three continents. Ophthalmology 108: 697–704. - PubMed
    1. Augood CA, Vingerling JR, de Jong PT, Chakravarthy U, Seland J, et al. (2006) Prevalence of age-related maculopathy in older Europeans: the European Eye Study (EUREYE). Arch Ophthalmol 124: 529–535. - PubMed

Publication types