

Categorical dimensions of human odor descriptor space revealed by non-negative matrix factorization
- PMID: 24058466
- PMCID: PMC3776812
- DOI: 10.1371/journal.pone.0073289
Categorical dimensions of human odor descriptor space revealed by non-negative matrix factorization
Abstract
In contrast to most other sensory modalities, the basic perceptual dimensions of olfaction remain unclear. Here, we use non-negative matrix factorization (NMF)--a dimensionality reduction technique--to uncover structure in a panel of odor profiles, with each odor defined as a point in multi-dimensional descriptor space. The properties of NMF are favorable for the analysis of such lexical and perceptual data, and lead to a high-dimensional account of odor space. We further provide evidence that odor dimensions apply categorically. That is, odor space is not occupied homogenously, but rather in a discrete and intrinsically clustered manner. We discuss the potential implications of these results for the neural coding of odors, as well as for developing classifiers on larger datasets that may be useful for predicting perceptual qualities from chemical structures.
Conflict of interest statement
Figures
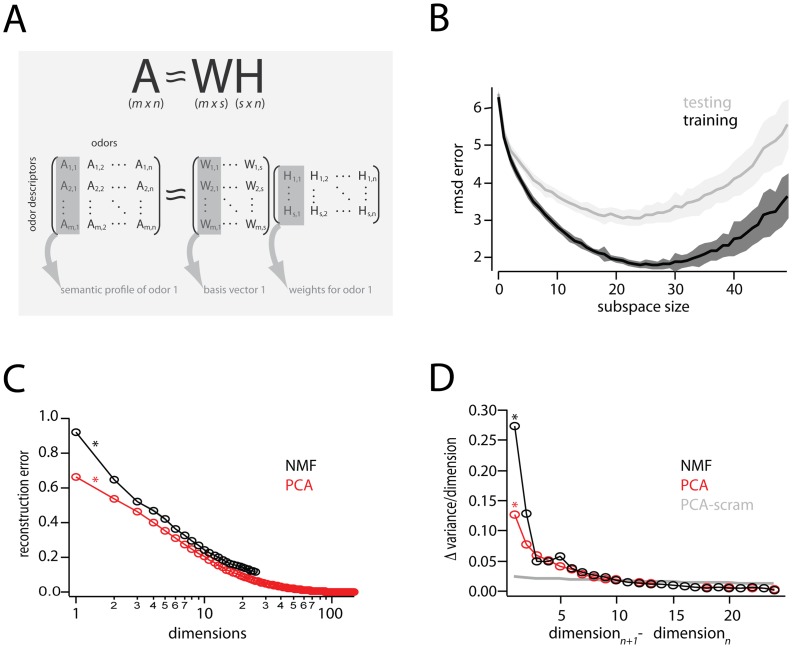
 Schematic Overview: NMF seeks a lower, s-dimensional approximation of a matrix
  as the product of matrices
  and
and  .
.  is
is  , consisting in the present study of
  odor descriptors
 odors. A given column of
  is the semantic profile of one odor, with each entry providing the percent-used value (see methods) of a given descriptor. Columns of
  are basis vectors of the reduced, s-dimensional odor descriptor space. Columns of
  are
are  -dimensional representations (weights) of the odors in the new basis.
  Plot of residual error between perceptual data,
  , and different NMF-derived approximations.
  . For each choice of subspace, data were divided into random training and testing halves, and residual error between
  and
and  computed. One-hundred such divisions into training and testing were used to compute the standard errors shown (shaded areas).
  Reconstruction error (fraction of unexplained variance) for PCA and NMF vs. number of dimensions. The change in reconstruction error for the first interval is indicated by asterisks(*), and corresponds to the first point in the next panel.
  Change in reconstruction error for PCA and NMF, compared to the change in reconstruction error for PCA performed on a scrambled matrix (
 ).
).  is used to estimate the cutoff number of dimensions for which a given dimensionality reduction method is explaining only noise in a dataset. Note that each point,
  , is actually the difference in reconstruction error between dimensions
  and
and  (by way of illustration, points with an asterisk in this panel denote corresponding intervals in the previous panel
  ).
).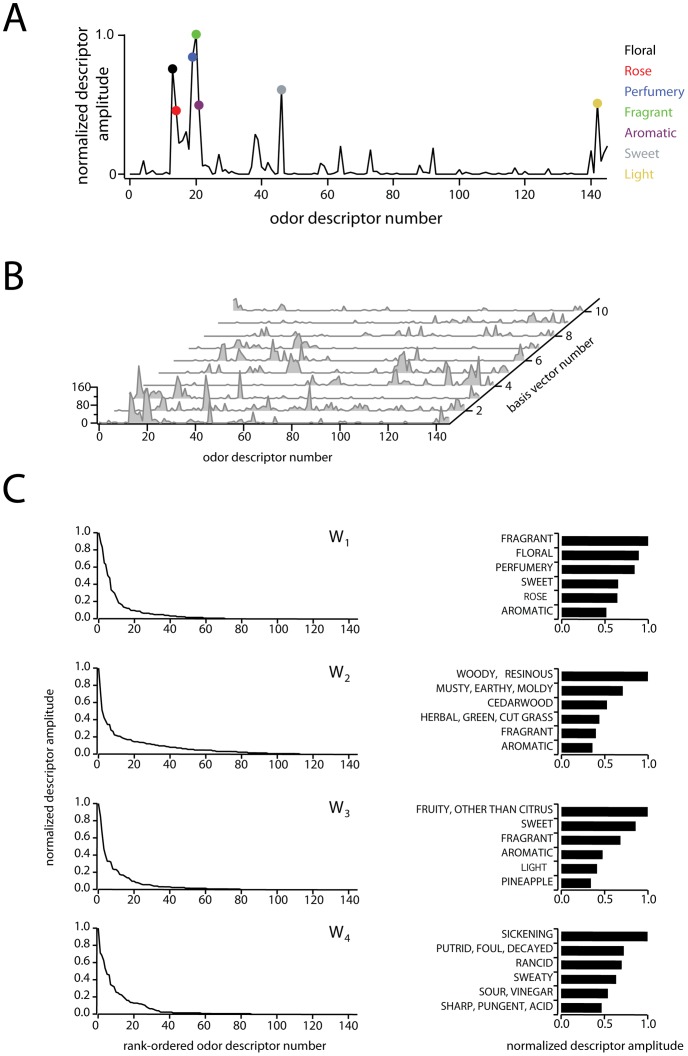
 . Each point along the x-axis corresponds to a single odor descriptor, and the amplitude of each descriptor indicates the descriptor's relevance to the shown perceptual basis vector. Colored circles show the
  largest points in the basis vector, and descriptors corresponding to these points are listed to the right.
  Waterfall plot of the 10 basis vectors constituting
  , used in subsequent analyses. Note that each vector contains many values close to or equal to zero.
  Detailed view of the first four basis vectors and their leading values. Left column: peak-normalized, rank ordered basis vectors, illustrating their sparseness and non-negativity. Right column: semantic descriptors characterizing the first four basis vectors. Bars show the first six rank-ordered, peak-normalized components of basis vectors 1 through 4 (subset of data from left column). The semantic label for each component is show to the left.
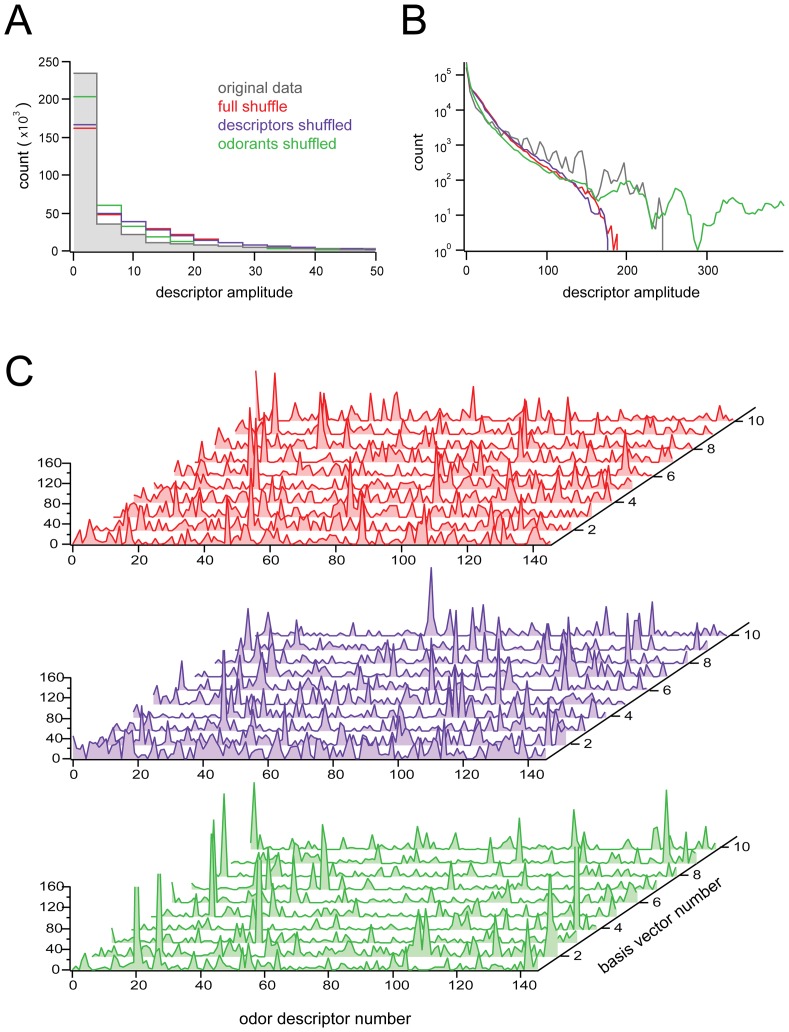
 Peak behavior of histograms obtained from NMF performed on shuffled data, for each of the various shuffling conditions (see text for descriptions).
  Tail behavior of histograms, same procedure and conditions as in
  ; note difference in scaling of axes between
  and
and  .
.  Waterfall plots of basis sets obtained when NMF was applied on shuffled data, for various shuffling conditions. Note the comparative lack of sparseness, relative to the basis set shown in Fig. 3A. Reproducibility of basis vectors across iterations of NMF for shuffled data sets was eliminated, or severely compromised, as shown in Fig. 4.
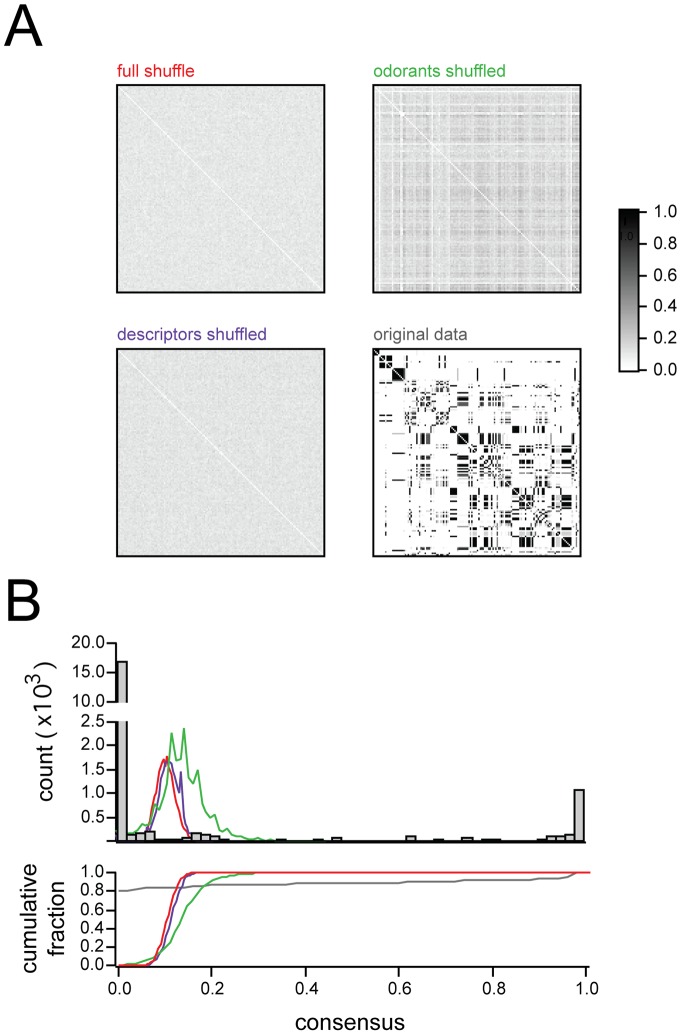
 Consensus matrices (see text) showing reliability of basis sets when NMF is applied to various shuffled versions of the data. Only the original data shows the bimodal distribution of 1s and 0s characteristic of highly reliable clustering. Image ranges and colorscale same for all 4 matrices.
  Top: Histograms of consensus matrix values for the three shuffling conditions, and the original data, confirming that only the original data shows a bimodal distribution of 1s and 0s (line colors correspond to labels in
  ). Bottom: Cumulative histograms, same data as above.
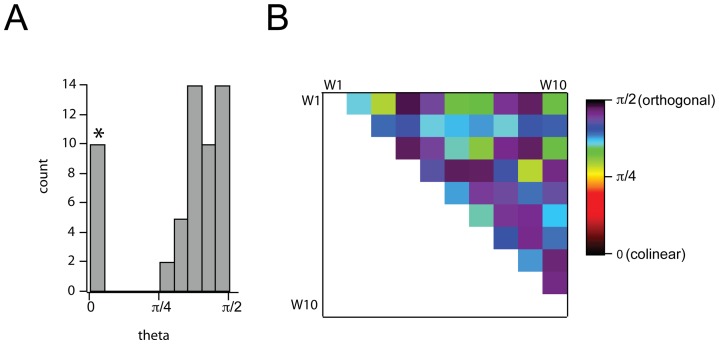
 Histogram of angles subtended by all pairs of basis vectors,
  . Histogram was constructed for all pairwise comparisons between dimensions, excluding self-comparisons. Bar with (*) denotes self-comparisons.
  Matrix of pairwise comparisons of angles between dimensions.
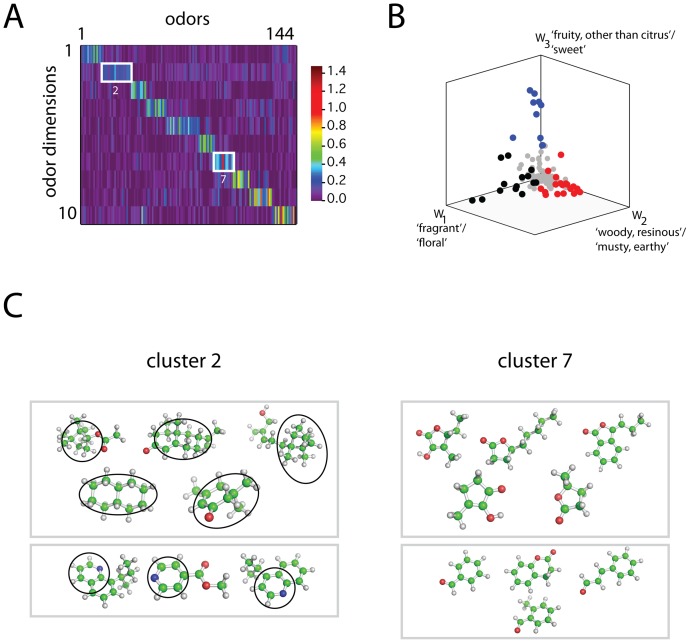
 The weight matrix,
  , discovered by NMF. Columns of
  (each column corresponds to a different odor), are normalized and sorted into groups defined by peak coordinate (1–10).
  Plot of all 144 odors (each point is a column of
  ) in the space spanned by the first 3 basis vectors,
  and
and  . Black, red, and blue points are those with peak coordinates in dimensions 1, 2, and 3 respectively. Gray points are all remaining odors.
  Chemical structures of representative odorants from the second and seventh diagonal blocks of the sorted matrix
  (panel
  ).
).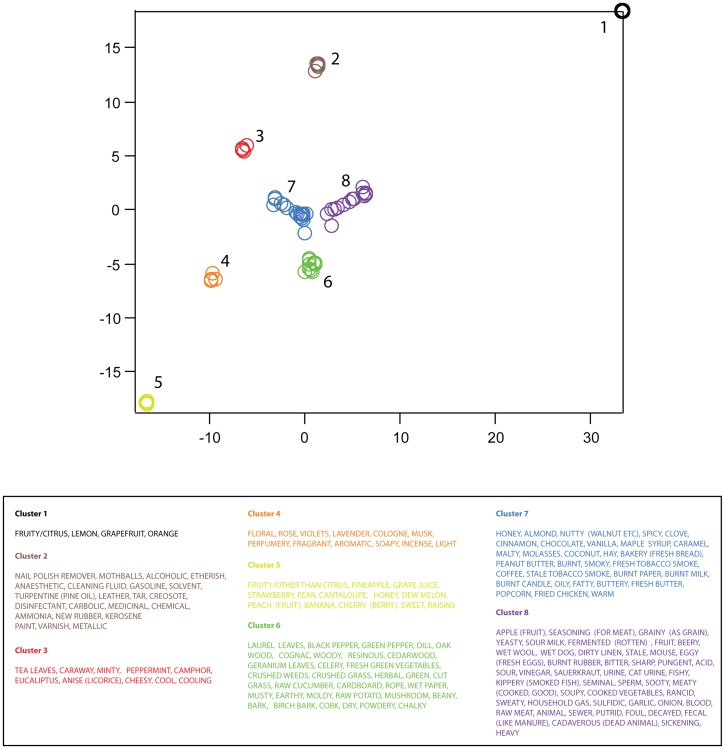
 . Axis units are arbitrary, but preserve neighbor relations present in the higher dimensional space,
  . Note that discrete clusters are clearly evident. Clusters were identified by eye, and descriptors composing each cluster are listed in the table below.
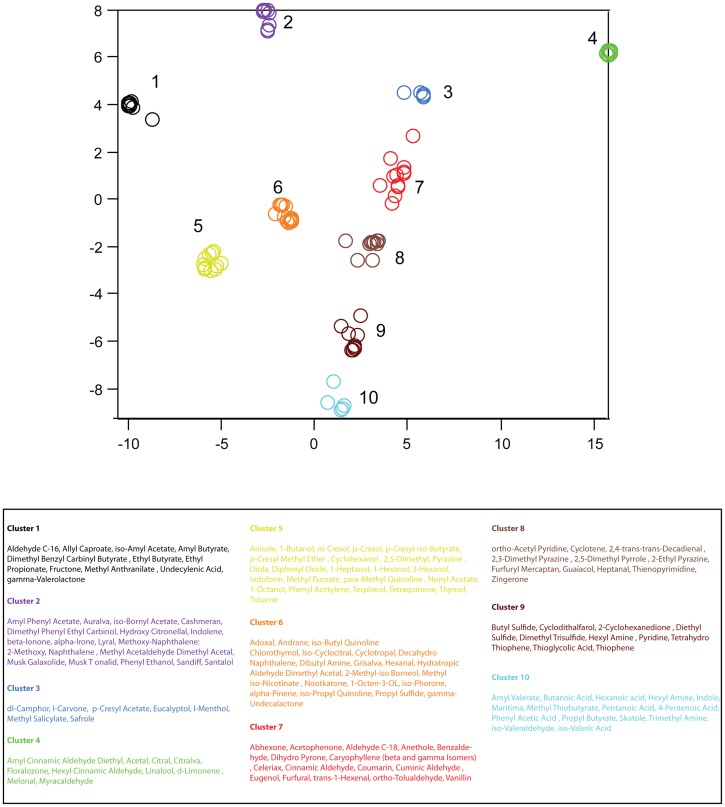
 . As in figure 7, axis units are arbitrary, but preserve neighbor relationships observed in the full-dimensional space,
  . Clusters were identified by eye, and odorants composing each cluster are listed in the table below.
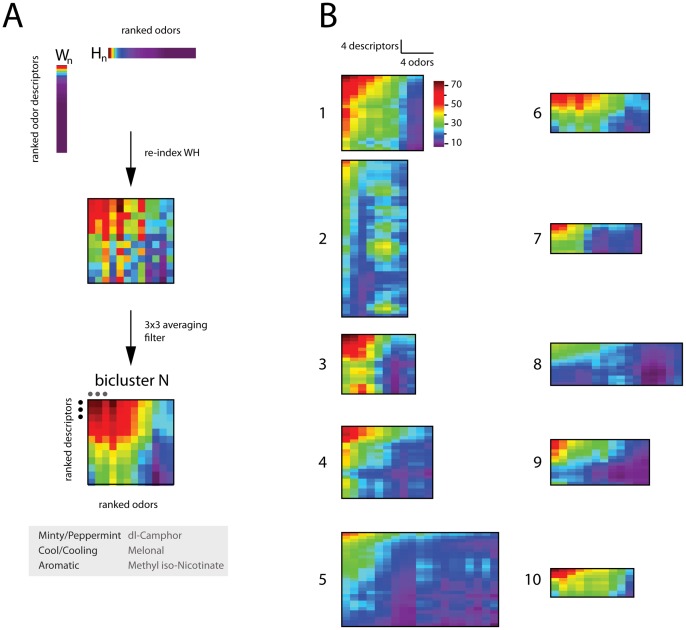
 Overview of method used for defining a bicluster (see text for definition). A column
  of
of  (descriptors), and the corresponding
  row of
  (odors) are rank ordered. The indices derived from the rank-ordering are used to re-order rows and columns of
  (accomplished by computing the outer product between the rank-ordered
  column of
  and rank-ordered
  row of
  ), producing a submatrix with high correlation among both odors and descriptors. By the nature of the sorting procedure, these matrices – biclusters – will have their largest values in the upper-left corner. For purposes of visualization, biclusters were convolved with an averaging filter.
  The 10 biclusters defined by NMF on odor perceptual data.
References
-
- Arzi A, Sobel N (2011) Olfactory perception as a compass for olfactory neural maps. Trends Cogn Sci (Regul Ed) 15: 537–545. - PubMed
-
- Lotto RB, Purves D (2002) A rationale for the structure of color space. Trends Neurosci 25: 84–88. - PubMed
-
- Lennie P, D'Zmura M (1988) Mechanisms of color vision. Crit Rev Neurobiol 3: 333–400. - PubMed
-
- Henning H (1916) Der Geruch. Leipzig.
-
- Amoore JE (1974) Evidence for the chemical olfactory code in man. Ann N Y Acad Sci 237: 137–143. - PubMed
Publication types
MeSH terms
Grants and funding
LinkOut - more resources
Full Text Sources
Other Literature Sources
