. 2013 Sep 13;8(9):e73658.
doi: 10.1371/journal.pone.0073658. eCollection 2013.

Broad MICA/B expression in the small bowel mucosa: a link between cellular stress and celiac disease

Affiliations

Broad MICA/B expression in the small bowel mucosa: a link between cellular stress and celiac disease

Yessica L Allegretti et al. PLoS One. .

Abstract

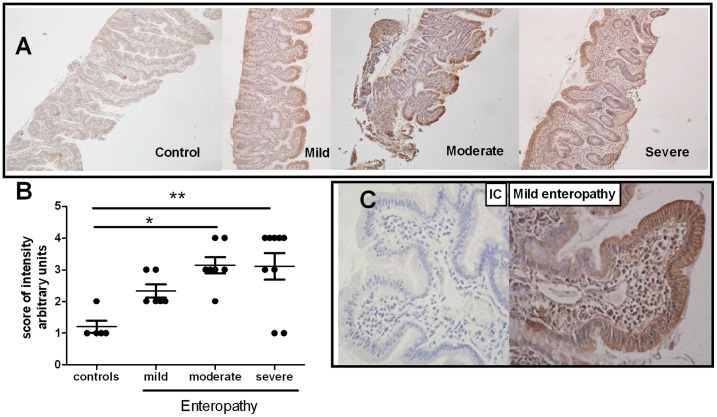
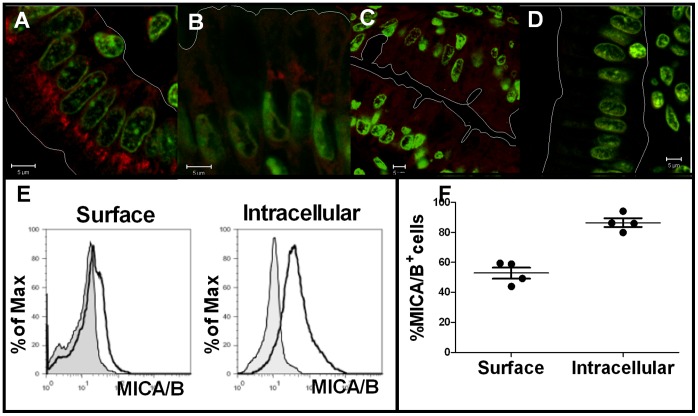
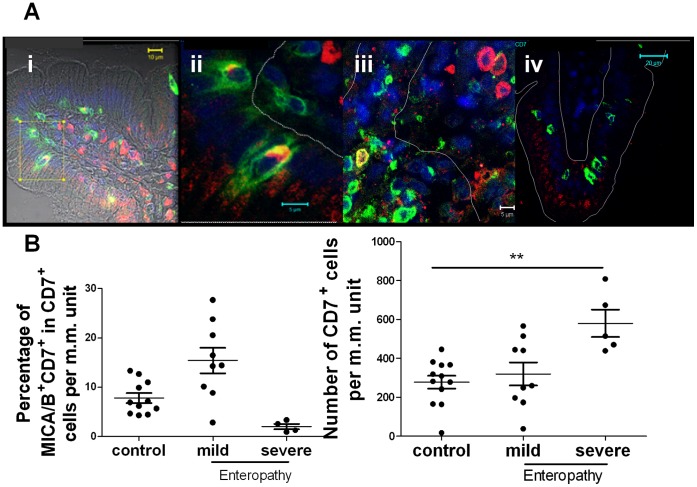
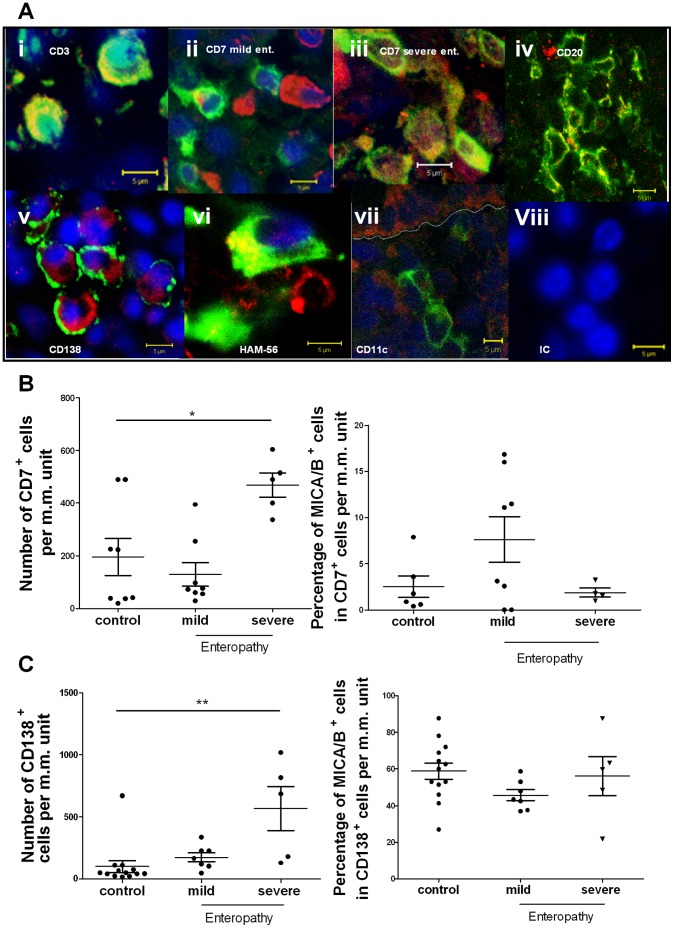
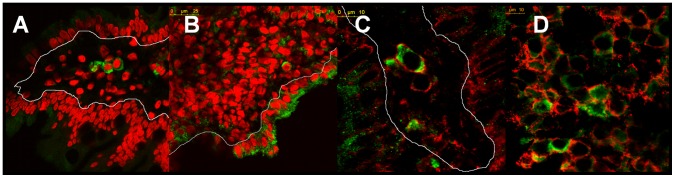
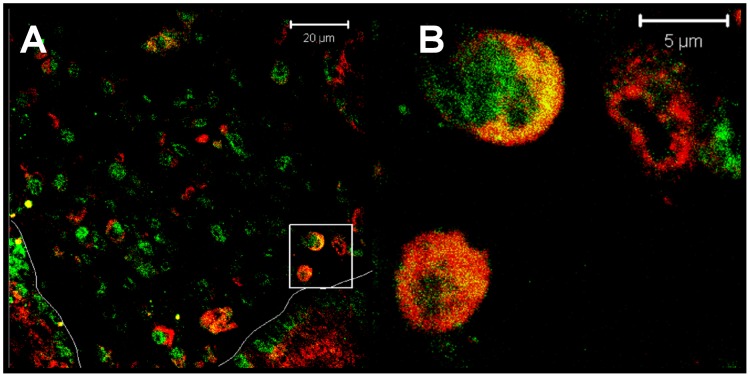
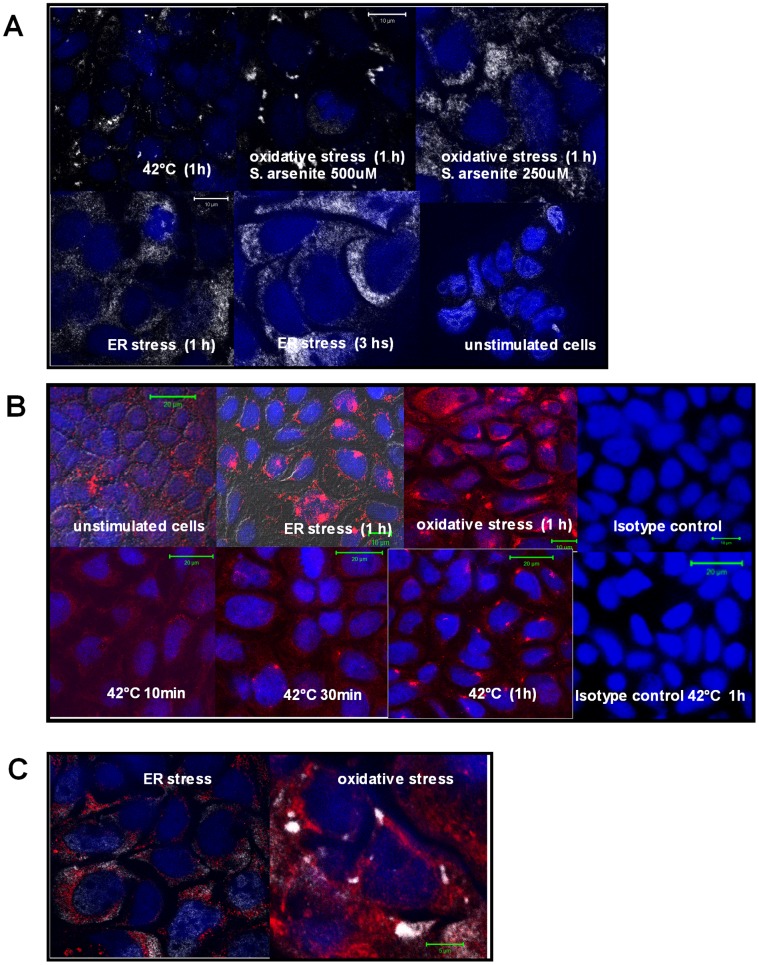
The MICA/B genes (MHC class I chain related genes A and B) encode for non conventional class I HLA molecules which have no role in antigen presentation. MICA/B are up-regulated by different stress conditions such as heat-shock, oxidative stress, neoplasic transformation and viral infection. Particularly, MICA/B are expressed in enterocytes where they can mediate enterocyte apoptosis when recognised by the activating NKG2D receptor present on intraepithelial lymphocytes. This mechanism was suggested to play a major pathogenic role in active celiac disease (CD). Due to the importance of MICA/B in CD pathogenesis we studied their expression in duodenal tissue from CD patients. By immunofluorescence confocal microscopy and flow cytometry we established that MICA/B was mainly intracellularly located in enterocytes. In addition, we identified MICA/B(+) T cells in both the intraepithelial and lamina propria compartments. We also found MICA/B(+) B cells, plasma cells and some macrophages in the lamina propria. The pattern of MICA/B staining in mucosal tissue in severe enteropathy was similar to that found in in vitro models of cellular stress. In such models, MICA/B were located in stress granules that are associated to the oxidative and ER stress response observed in active CD enteropathy. Our results suggest that expression of MICA/B in the intestinal mucosa of CD patients is linked to disregulation of mucosa homeostasis in which the stress response plays an active role.


Conflict of interest statement

Competing Interests: The authors have declared that no competing interests exist.

Figures

Figure 1
Figure 1. MICA expression in intestinal mucosa of CD patients.
A.- Representative immunoperoxidase staining of MICA/B in intestinal biopsy sections from pediatric CD patients with different degrees of lesion (mild, moderate and severe enteropathy; magnification 20×). B.- Immunohistochemical analysis for MICA/B expression in sections of intestinal biopsies from 27 pediatric patients. An arbitrary score of intensity of staining was used (from 0 to 4). The IC control antibody was defined as score zero. Each dot corresponds to the score obtained for each sample. * p≤0,05; ** p≤0,01 (Non parametric Kruskal wallis test followed by the Dunns multiple-comparison posttest).C.- Pattern of MICA/B expression along the epithelium on a mild enteropathy sample. Isotype Control (IC) is shown (magnification 40×).
Figure 2
Figure 2. Confocal immunofluorescent analysis showing MICA/B staining.
A.- sample from an untreated CD pediatric patient with mild enteropathy showing the MICA/B expression (red) in enterocytes. SYTO® 13 (Green Fluorescent Nucleic Acid Stain) was used to stain nuclei. B.- MICA/B staining in an intestinal section from the same patient after two years on a gluten-free diet. C.- healthy non-celiac control patient. D. IC incubated in a section corresponding to sample A. (Magnification 63×). E.- Flow cytometric analysis for surface and intracellular expression of MICA/B in epithelial CD3 cells of a representative paediatric patient. F.- Flow cytometric analysis for surface and intracellular expression of MICA/B in epithelial CD3 cells of duodenal samples from adult CD patients.
Figure 3
Figure 3. MICA/B+ cells in the intraepithelial compartment.
A.- Immunofluorescent confocal microscopic analysis on small intestinal sections showing CD7+ cells (green), MICA/B+ cells (red) and nuclei (blue). (i) Mild enteropathy sample (ii) Enlarged section of (i). (iii) Severe enteropathy sample. (iv) Duodenal section from a healthy control. Intraepithelial and lamina propria compartments were delimited in the picture with a thin line (scan zoom 0.7, magnification 100×). B.- Numbers of CD7+MICA/B+ were determined per unit of muscularis mucosae m.m. using immunofluorescent microscopy on duodenal sections of 11 healthy controls, 9 patients with mild enteropathy and 4 patients with severe enteropathy. Percentage of CD7+MICA+ cells (left plot) and total number of CD7+ cells (right plot) were depicted. ** p≤0.01, (Non parametric Kruskal wallis test followed by the Dunns multiple-comparison posttest).
Figure 4
Figure 4. MICA/B+ cells in the lamina propria.
A.- Immunofluorescent confocal microscopic analysis was performed in paraffin embedded sections from tissues with severe enteropathy (i, iii, iv, v, vi, vii, viii) and mild enteropathy (ii). Sections were stained as follows: MICA/B (red), Nuclei (blue). i. CD3+ cells (green). ii and iii. CD7+ cells (green).. iv. CD20+ (green). v. CD138+ cells (green). vi. HAM-56+ cells (green). vii. CD11c+ cells (green). viii. IC antibody (all cell lineage markers in green). (scan zoom 0.7, magnification 100×). B.- Expression of MICA/B in CD7+ cells in sections of small intestine samples of 6 healthy controls, 8 mild enteropathy samples and 4 severe enteropathy samples. Percentage of MICA/B+ cells in the CD7+ population (left panel) and total number of lamina propria CD7+ cells per unit of m.m. (right panel) were plotted. * p≤0,05; (Non parametric Kruskal wallis test followed by the Dunns multiple-comparison posttest). C.- Expression of MICA/B in CD138+ cells in sections of small intestine samples of 13 healthy controls, 7 mild enteropathy and 5 severe enteropathy. Percentage of MICA/B+ cells on the CD138+ population (left panel) and total number of lamina propria CD138+ cells per unit of m.m (right panel). ** p≤0.01, (Non parametric Kruskal wallis test followed by the Dunns multiple-comparison posttest).
Figure 5
Figure 5. BiP expression in duodenal mucosa.
Immunofluorescent confocal analysis on duodenal biopsy samples of a healthy control (A) and a severe enteropathy of a CD patient (B) showing BiP expression (green) and nuclei (red, propidium iodide) (scan zoom 1,7, magnification 63×). Healthy control (C) and severe enteropathy of a CD patient (D) showing BiP (green) and CD138 (red) expression. (scan zoom 4.2 and 3.5, respectively, magnification 63×).
Figure 6
Figure 6. TIA-1+ granules indicate stress in the intestinal mucosa in active CD.
MICA/B cytoplasmic expression colocalized with TIA-1+ granules. (A) MICA/B (red) and TIA-1 (green) in different cell populations in a severe enteropathy of a CD patient. Epithelium was delimited in the picture with a thin line (scan zoom 0.7, magnification 100×). (B) Enlarged picture of (A).
Figure 7
Figure 7. In vitro stress treatments change the pattern of MICA/B expression. A. Induction of TIA-1+ granules in Caco-2 cells.
Confocal microscopic analysis of Caco-2 cells treated during different periods of time with thapsigargin, sodium arsenite or fever-range temperature showing redistribution of TIA-1 (white) into stress granules. Nuclei (blue). (scan zoom 0,7, magnification 100×). B.- Redistribution of MICA/B in treated Caco-2 cells. Confocal microscopic analysis of Caco-2 cells treated during different periods of time with thapsigargin, sodium arsenite or fever-range temperature showing redistribution of MICA/B (red) in cytoplasmic aggregates. Nuclei (blue). (scan zoom 0,7, magnification 100×). C.- Distribution of MICA/B and TIA-1 in Caco-2 treated cells. Confocal microscopy of Caco-2 cells treated with thapsigargin (ER stress) or sodium arsenite (oxidative stress) for 1 hour, showing MICA/B (red) and TIA-1 (white) (magnification 100×). In both cases, MICA/B+ structures were not associated to stress TIA-1+ granules. (scan zoom 0,7, magnification 100×).

References

    1. Stastny P (2006) MICA/MICB in innate immunity, adaptive immunity, autoimmunity, cancer, and in the immune response to transplants. Hum Immunol 67(3): 141–4. - PubMed
    1. Groh V, Bahram S, Bauer S, Herman A, Beauchamp M, et al. (1996) Cell stress-regulated human major histocompatibility complex class I gene expressed in gastrointestinal epithelium. Proc Natl Acad Sci 93: 12445–50. - PMC - PubMed
    1. Groh V, Steinle A, Bauer S, Spies T (1998) Recognition of stress induced MHC molecules by intestinal epithelial gammadelta T cells. Science 279: 1737–40. - PubMed
    1. Venkataraman GM, Suciu D, Groh V, Boss JM, Spies T (2007) Promoter region architecture and transcriptional regulation of the genes for the MHC class I-related chain A and B ligands of NKG2D. J Immunol 178: 961–69. - PubMed
    1. Groh V, Rhinehart R, Randolph-Habecker J, Topp MS, Riddell SR, et al. (2001) Costimulation of CD8alphabeta T cells by NKG2D via engagement by MIC induced on virus-infected cells. Nat Immunol 2: 255–60. - PubMed

Publication types

MeSH terms

Substances