. 2013 Sep 10;8(9):e74436.
doi: 10.1371/journal.pone.0074436. eCollection 2013.

Direct regulation of cytochrome c oxidase by calcium ions

Affiliations

Direct regulation of cytochrome c oxidase by calcium ions

Tatiana Vygodina et al. PLoS One. .

Abstract

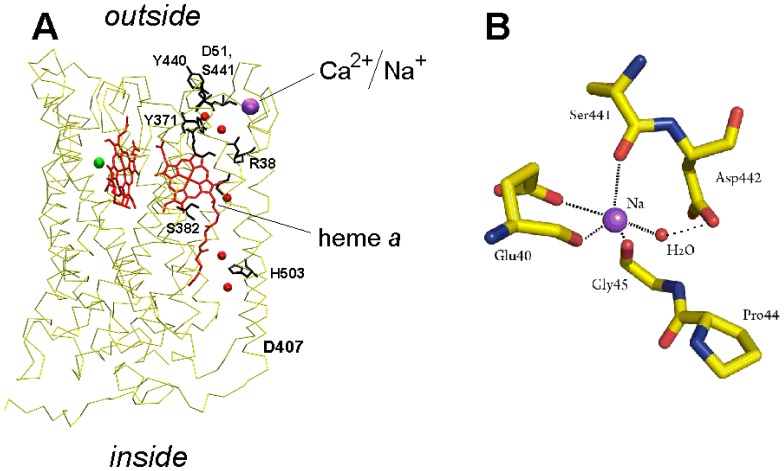
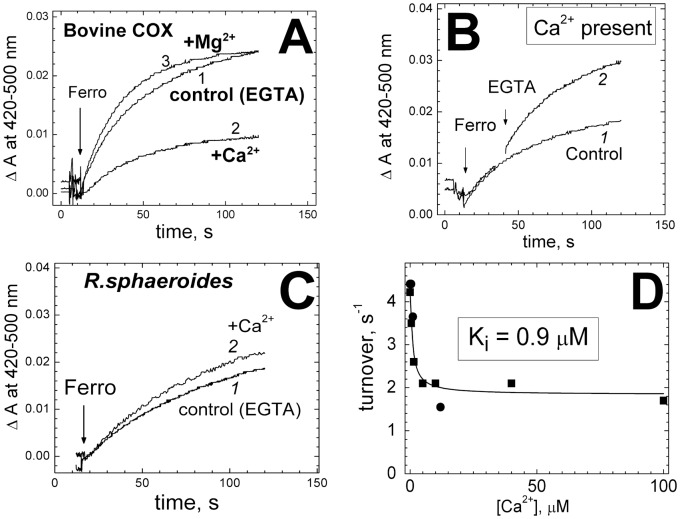
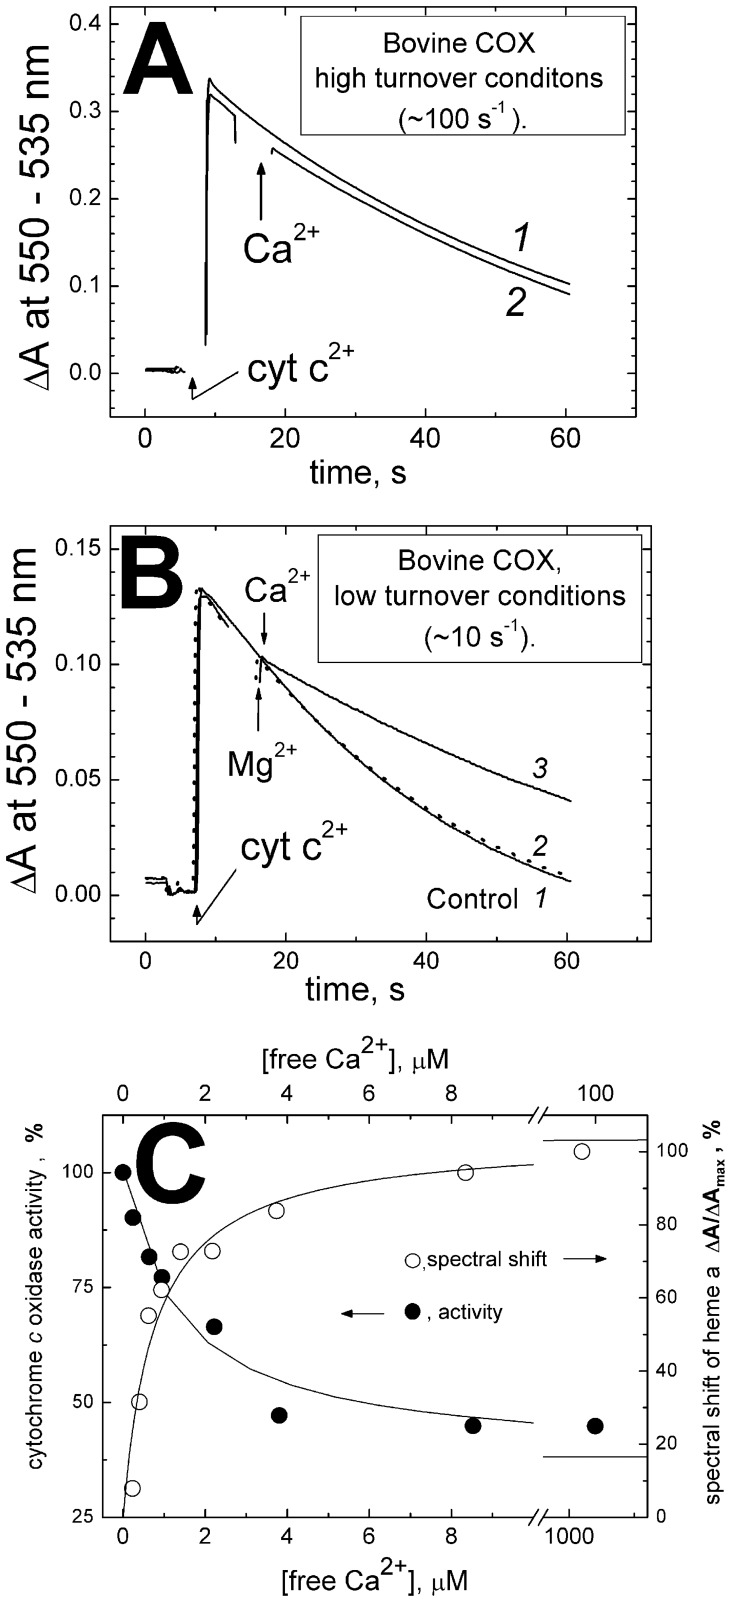
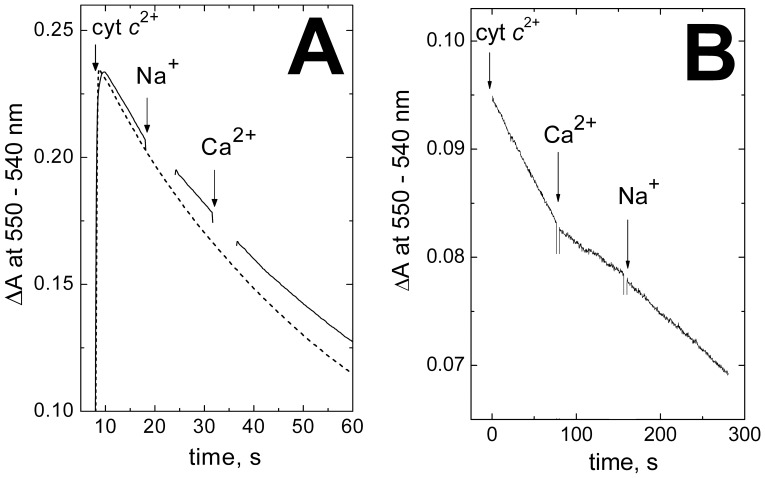
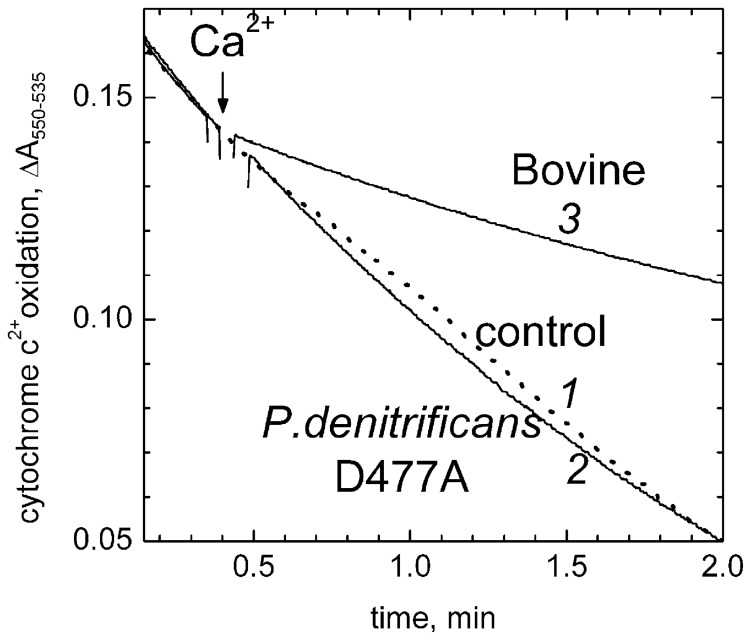
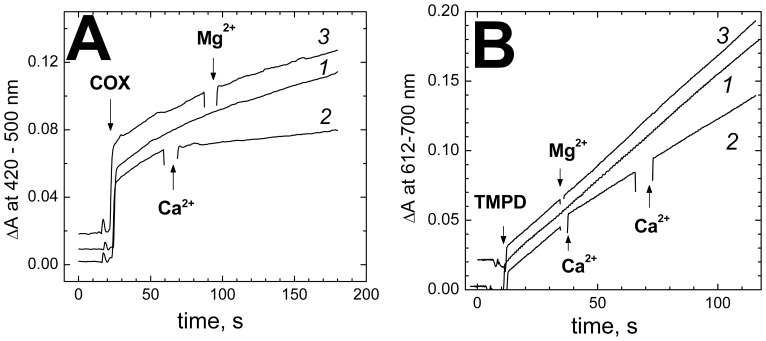
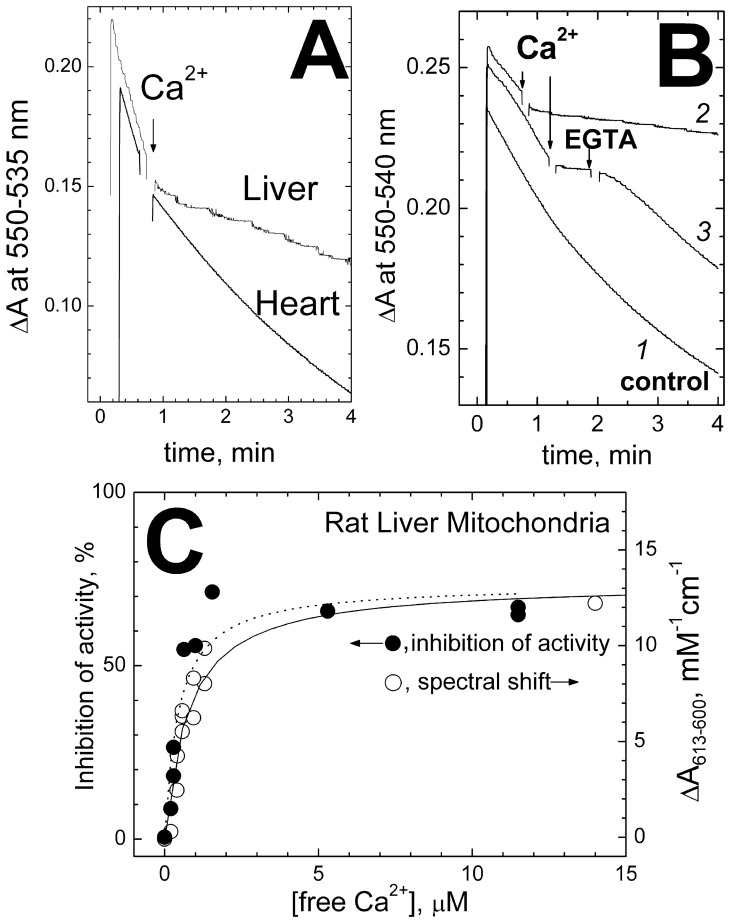
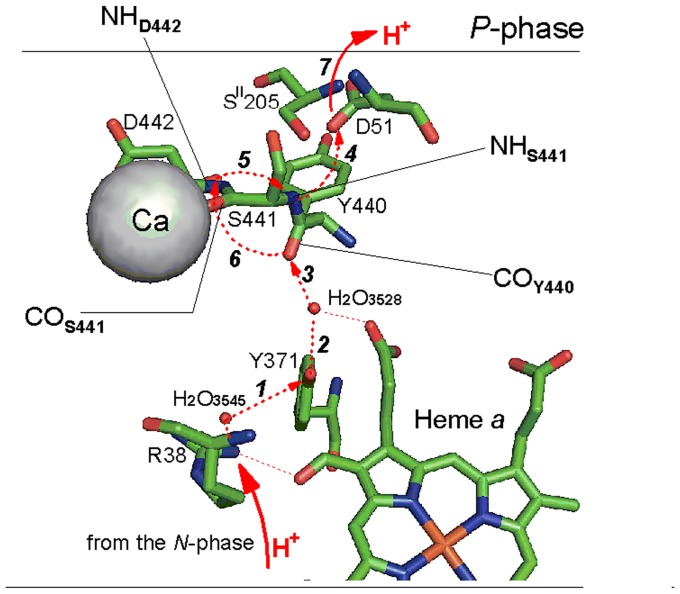
Cytochrome c oxidase from bovine heart binds Ca(2+) reversibly at a specific Cation Binding Site located near the outer face of the mitochondrial membrane. Ca(2+) shifts the absorption spectrum of heme a, which allowed previously to determine the kinetics and equilibrium characteristics of the binding. However, no effect of Ca(2+) on the functional characteristics of cytochrome oxidase was revealed earlier. Here we report that Ca(2+) inhibits cytochrome oxidase activity of isolated bovine heart enzyme by 50-60% with Ki of ∼1 µM, close to Kd of calcium binding with the oxidase determined spectrophotometrically. The inhibition is observed only at low, but physiologically relevant, turnover rates of the enzyme (∼10 s(-1) or less). No inhibitory effect of Ca(2+) is observed under conventional conditions of cytochrome c oxidase activity assays (turnover number >100 s(-1) at pH 8), which may explain why the effect was not noticed earlier. The inhibition is specific for Ca(2+) and is reversed by EGTA. Na(+) ions that compete with Ca(2+) for binding with the Cation Binding Site, do not affect significantly activity of the enzyme but counteract the inhibitory effect of Ca(2+). The Ca(2+)-induced inhibition of cytochrome c oxidase is observed also with the uncoupled mitochondria from several rat tissues. At the same time, calcium ions do not inhibit activity of the homologous bacterial cytochrome oxidases. Possible mechanisms of the inhibition are discussed as well as potential physiological role of Ca(2+) binding with cytochrome oxidase. Ca(2+)- binding at the Cation Binding Site is proposed to inhibit proton-transfer through the exit part of the proton conducting pathway H in the mammalian oxidases.


Conflict of interest statement

Competing Interests: The authors have declared that no competing interests exist.

Figures

Figure 1
Figure 1. The Cation Binding Site in cytochrome c oxidase.
(A) Location of the Cation Binding Site in subunit I of bovine enzyme and its relation to the proposed proton conducting pathway H. Components of the H-pathway are depicted as orange spheres (fixed water molecules) and black sticks (amino acid residues, A-propionate and carbonyl groups of heme a). Enlarged picture of the exit part of the H-channel is shown in Figure 8. (B) Coordination sphere of the bound cation in bovine oxidase. Based on the PDB 1V55 structure.
Figure 2
Figure 2. Ca2+ ions inhibit cytochrome c- catalyzed oxidation of ferrocyanide by cytochrome oxidase.
(A) 0.3 µM bovine COX in the basic medium (100 µM EGTA present) with 40 nM cytochrome c. Where indicated, 1 mM ferrocyanide (ferro) was added, and its oxidation to ferricyanide was followed spectrophotometrically at 420 nm vs the 500 nm reference. Trace 1, control recording; trace 2, +200 µM CaCl2 (100 µM excess over EGTA); trace 3, +0.4 mM Mg2+ (300 µM excess over EGTA). (B) Conditions, as in panel A, trace 2 (100 µM excess of CaCl2 over EGTA). In trace 2, 300 µM EGTA has been added. (C) 0.2 µM wild-type COX from R.sphaeroides. Trace 1, control (100 µM EGTA). Trace 2, with 200 µM CaCl2. (D) Concentration dependence of the inhibition. Initial rate of ferrocyanide oxidation by COX (0.3 µM) is plotted vs concentration of free Ca2+ buffered with 1 mM NTA (squares) or 1 mM BAPTA (circles). The curve corresponds to Ki of 0.9 µM and maximal inhibition of 60%.
Figure 4
Figure 4. Inhibition of the ferrocytochrome c oxidase activity of bovine COX by Ca2+ ions.
(A) High-turnover conditions. 4 nM COX in the basic medium (with 50 mM choline chloride and 100 µM EGTA). 18 µM reduced cytochrome c is added and its subsequent oxidation is followed spectrophotometrically at 550 nm vs the 535 nm reference. Trace 1, control recording; trace 2, 200 µM CaCl2 added where indicated. (B) Low-turnover conditions. Conditions as in (A), but choline chloride concentration increased to 0.5 M and 18 µM oxidized cytochrome c present in the buffer; COX concentration raised to 20 nM. Trace 1 (solid line), control recording; traces 2,3: where indicated, 0.4 mM MgCl2 (dashed line) or 200 µM CaCl2 (solid line) are added. (C) Titration of the Ca2+-induced inhibition of COX activity and of the red shift of heme a spectrum. Cytochrome c 2+ oxidation was measured as in Panel B, trace 1 at different concentrations of free calcium buffered with 5 mM HEDTA. The initial rates were used to build the plot. Spectral shift measurements (see Materials and Methods) were made in the basic buffer with 2 µM COX. Concentration of free Ca2+ was buffered with 5 mM HEDTA. The points are fitted by the curves: maximal inhibition, 63±5%, Ki = 1.4±0.4 µM; the spectral shift, ΔAmax = 103% of the highest experimentally observed ΔA value taken as 100%; Kd = 0.77±0.19 µM.
Figure 5
Figure 5. Na+ ions counteract the Ca2+ -induced inhibition of cytochrome c oxidase activity of bovine COX.
(A) Bovine COX (30 nM) in the basic medium with 0.4 M choline chloride and 15 µM oxidized cytochrome c. The reaction is initiated by addition of 15 µM ferrocytochrome c and oxidation of c 2+ is followed in a dual-wavelength mode at 550 nm vs the 540 nm reference wavelength. Dashed line, control recording (no additions). Solid line, 50 mM NaCl and 200 µM CaCl2 (100 µM excess over EGTA) are added where indicated. (B) Bovine COX (1.3 nM) in the basic medium with 0.4 M choline chloride and with no oxidized cytochrome c. Reaction is initiated by addition of 6 µM ferrocytochrome c. Other additions, as in (A).
Figure 6
Figure 6. Ca2+ does not inhibit cytochrome c 2+ oxidase activity of D477A mutant COX from P.denitrificans.
D477A mutant COX (1.5 nM) in the basic medium with 0.4 M choline chloride. Oxidation of 10 µM reduced cytochrome c is followed spectrophotometrically in a dual-wavelength mode at 550 nm vs the 535 nm reference. Trace 1 (dotted line), control recording with no calcium added; trace 2, 200 µM CaCl2 added where indicated. Trace 3, the same conditions as in trace 2 but with 2.5 nM bovine heart COX.
Figure 3
Figure 3. Ca2+ inhibits aerobic oxidation of artificial electron donors by COX.
(A) Oxidation of ferrocyanide. 0.2 mM ferrocyanide in the basic buffer pH 8.2, supplemented with 30 µg/ml of poly-L-lysine to stimulate reaction of COX with ferrocyanide anion . Reaction is initiated by addition of 0.4 µM bovine COX and accumulation of ferricyanide is followed at 420 nm vs the 500 nm reference. Trace 1, control recording with no other additions; trace 2, 200 µM CaCl2 added where indicated; trace 3, 400 µM MgSO4 added instead of CaCl2. The initial upward jump of the traces is due to absorption of the added COX. (B) Oxidation of N,N,N’,N’ – tetrametyl-p-phenylenediamine. 0.15 µM bovine COX in the basic buffer. Where indicated, 0.1 mM reduced TMPD is added, and its oxidation to Wurster’s Blue is followed spectrophotometrically at 612 nm vs the 700 nm reference. Trace 1, control recording with no additions; trace 2, 200 µM CaCl2 added where indicated, note that the second addition does not induce any further inhibition; trace 3, 200 µM Mg2+ added where indicated. The kinetics curves in the panels A and B are displaced arbitrarily on the ordinate axis for clarity.
Figure 7
Figure 7. Ca2+-induced inhibition of ferrocytochrome c oxidase activity in mitochondria.
(A) Rat liver (1.3 mg protein/ml) or rat heart mitochondria (0.6 mg protein/ml) in the medium containing 0.25 M sucrose, 50 mM HEPES/tris pH 8.0, 0.4 M choline chloride, 100 µM EGTA, and also 1 µM cyclosporine A and 1 µM the uncoupler, CCCP. 15 µM of the reduced cytochrome c is added and its oxidation is followed at 550 nm vs the 535 nm reference. Ca2+ addition, 200 µM. (B) Rat liver mitochondria. Conditions, as in trace 1 of panel A. Additions: CaCl2, 200 µM; EGTA, 300 µM. The traces in the Panels A,B have been displaced arbitrarily on the ordinate scale for clarity. (C) Concentration dependences of the Ca2+-induced inhibition of COX and spectral shift of heme a in rat liver mitochondria. Cytochrome c 2+ oxidation was measured as in Figure 7B , trace 1 at different concentrations of free calcium buffered with 5 mM HEDTA or 5 mM NTA. The initial slopes of the kinetic curves were used to build the plot. The data have been approximated by a hyperbolic curve (solid line) with the maximal inhibition of 74% and Ki = 0.76 µM. The Ca2+-induced spectral shift of the reduced heme a was measured in an SLM-Aminco-2000C spectrophotometer (see Materials and methods). To decrease light scattering, the mitochondria (10–15 mg protein/ml) were treated with 1% dodecyl maltoside. The data are approximated by a curve (dashed line) with ΔA613–600 (max) = 13 mM−1cm−1, and Kd = 0.56 µM.
Figure 8
Figure 8. Interaction of Ca2+ with the exit of proton channel H in bovine heart oxidase.
Structure of the exit part of the H-channel is shown based on the oxidized COX crystal structure, PDB entry 1V54. All the groups shown belong to subunit I (polypeptide A) except for SII205 from subunit II (polypeptide B). The scheme gives a scenario of proton transfer combined from refs. , , . Proton trajectory is depicted by red arrows and sequence of the proton transfer steps is indicated by numbers. Oxidation of heme a by the binuclear site brings about a conformational change that unlocks the H-channel below the heme (cf. for an alternative proposal) and pumped proton arrives to the guanidine group of R38 from the N-aqueous phase (step 1) via the input part of the H-channel (cf. Figure 1A ); it travels further via the R38-bound H2O3545 (that has then to shift closer to Y371), OH group of Y371 and H2O3528 to finally protonate the backbone carbonyl group of Y440 (steps 24). The carbonyl function C = OY440 protonated, makes the -NHS441 acidic (imidic acid) and allows for its facile spontaneous deprotonation by carboxylate of D51 (step 5), converting the S441-Y440 peptide bond to the enol form. The protonated state of D51 is then stabilized by multiple hydrogen bonding to SII205 and S441. As proposed in , the enol form of the S441-Y440 peptide bond returns to the initial keto form (the notorious proton transfer via the peptide bond S441-Y440 [44], [45], [49]) actually in two steps. First, the deprotonated enolic = NS441 receives proton from the backbone -NH of D442 (step 6, the rate limiting stage of the entire process), which is followed by facile reprotonation of -N- D442 by the protonated backbone C-OHY440 (step 7) returning the latter to the initial carbonyl state. Upon subsequent reduction of heme a, D51 undergoes reorientation associated with loss of the stabilizing hydrogen bonding to SII205 and, hence, decreased proton affinity, so that its carboxylic group releases the proton to the P-phase (step 8). Ca2+ coordinates to the backbone carbonyl oxygen of S441, and also makes a bond with the carboxylate of D442 via intercalated fixed water molecule (hidden behind the Ca ion in this projection of the structure, cf. H2O3544 in Figure 1B and see ref. [14]). As discussed in the text, Ca2+ is expected to inhibit proton transfer through the exit part of the H-channel and, accordingly, to impede the proton transfer-coupled electron transfer by COX.

References

    1. Ferguson-Miller S, Babcock GT (1996) Heme/Copper Terminal Oxidases. Chem Rev 7: 2889–2907. - PubMed
    1. Brzezinski P, Gennis RB (2008) Cytochrome c oxidase: exciting progress and remaining mysteries. J Bioenerg Biomembr 40: 521–531. - PMC - PubMed
    1. Belevich I, Verkhovsky MI (2008) Molecular Mechanism of Proton Translocation by Cytochrome c Oxidase. Antioxidants and Redox Signaling 10: 1–29. - PubMed
    1. Einarsdottir O, Caughey W (1985) Bovine heart cytochrome c oxidase preparations contain high affinity binding sites for magnesium as well as for zinc, copper, and heme iron. Biochem Biophys Res Commun 129: 840–847. - PubMed
    1. Iwata S, Ostermeier C, Ludwig B, Michel H (1995) Structure at 2.8 A Resolution of Cytochrome c Oxidase from Paracoccus denitrificans . Nature 376: 660–669. - PubMed

Publication types

MeSH terms

LinkOut - more resources