. 2013 Sep 18;8(9):e74454.
doi: 10.1371/journal.pone.0074454. eCollection 2013.

Differential joint-specific corticospinal tract projections within the cervical enlargement

Affiliations

Differential joint-specific corticospinal tract projections within the cervical enlargement

Curtis O Asante et al. PLoS One. .

Abstract

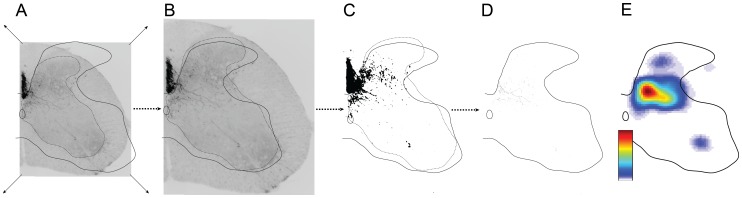
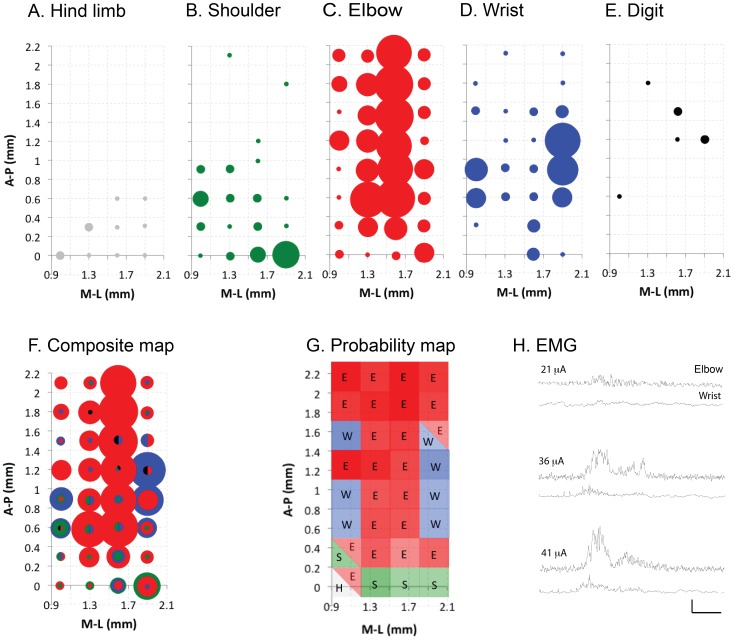
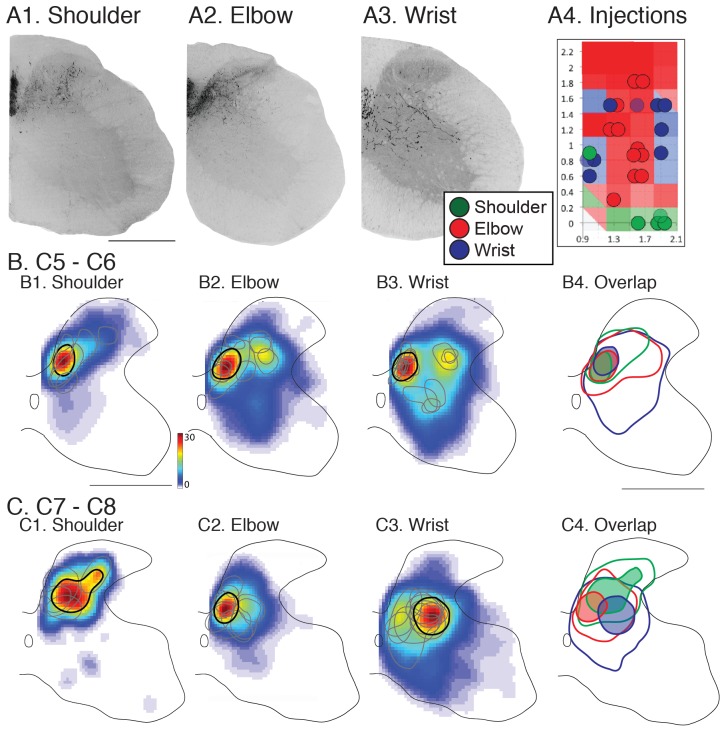
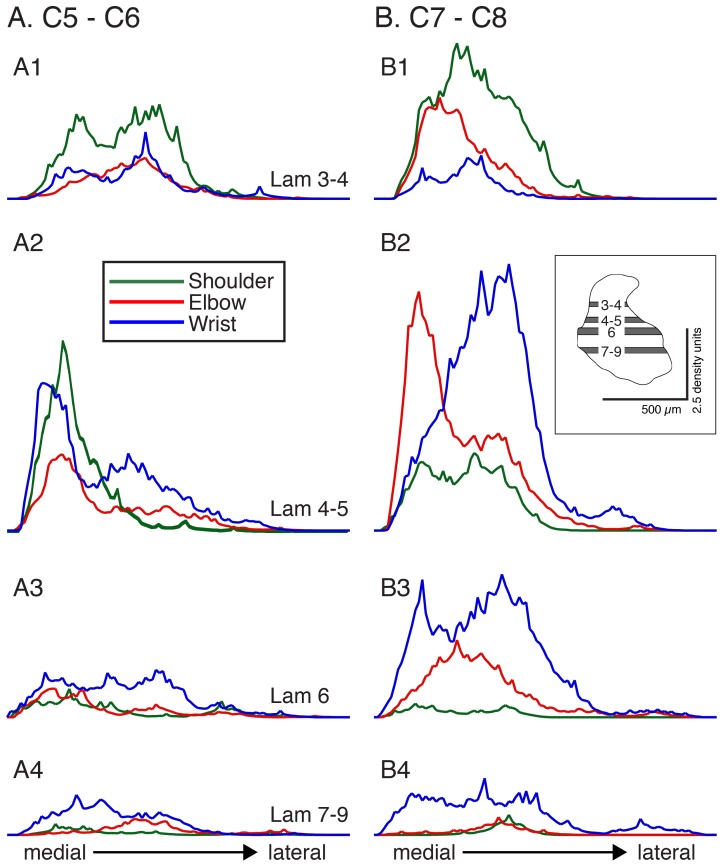
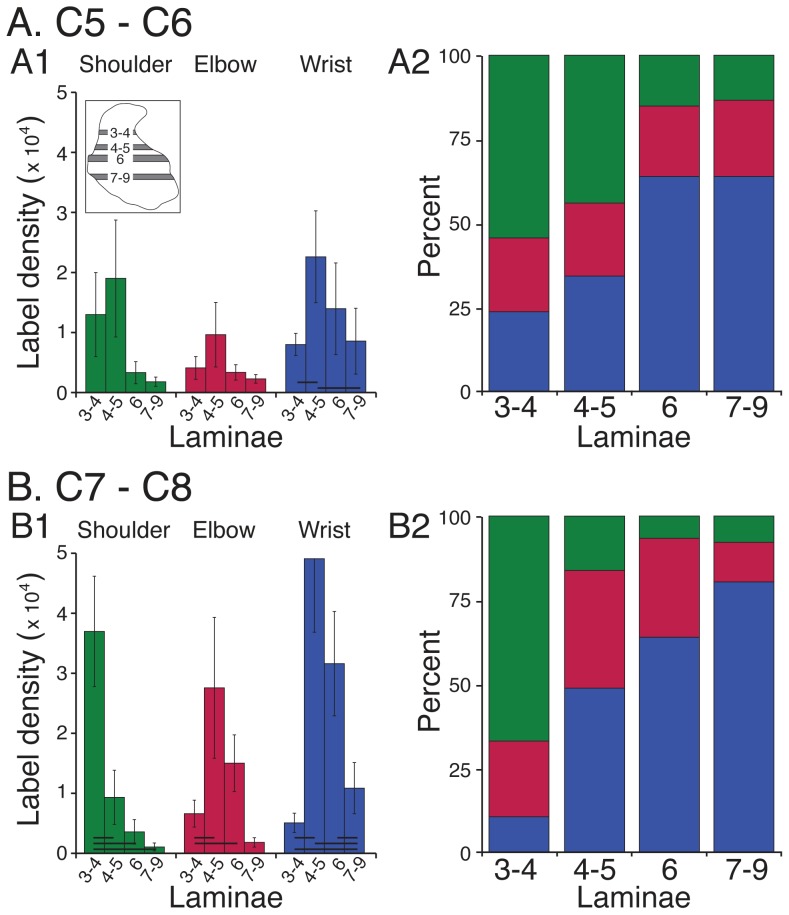
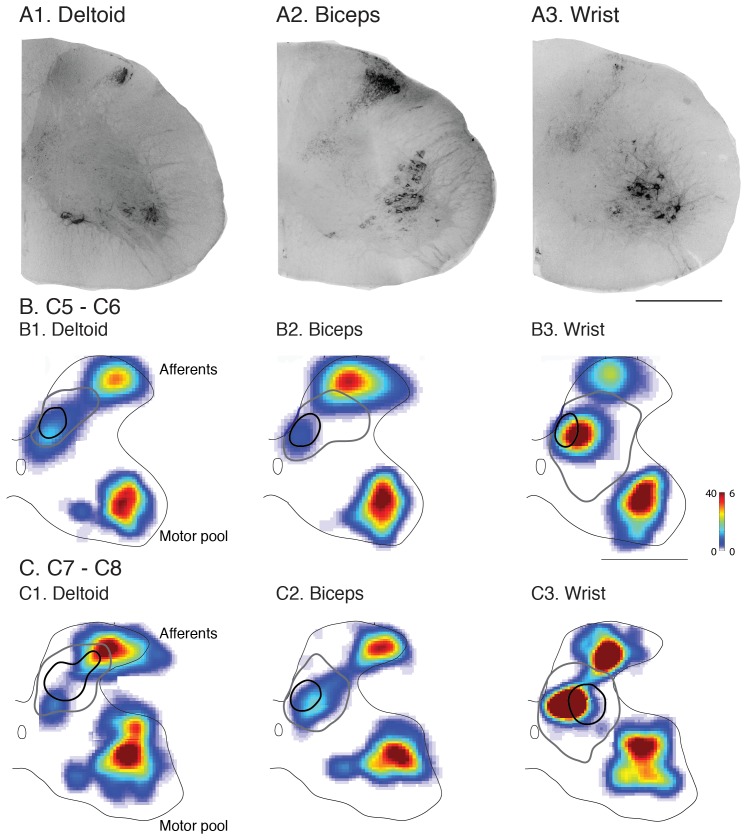
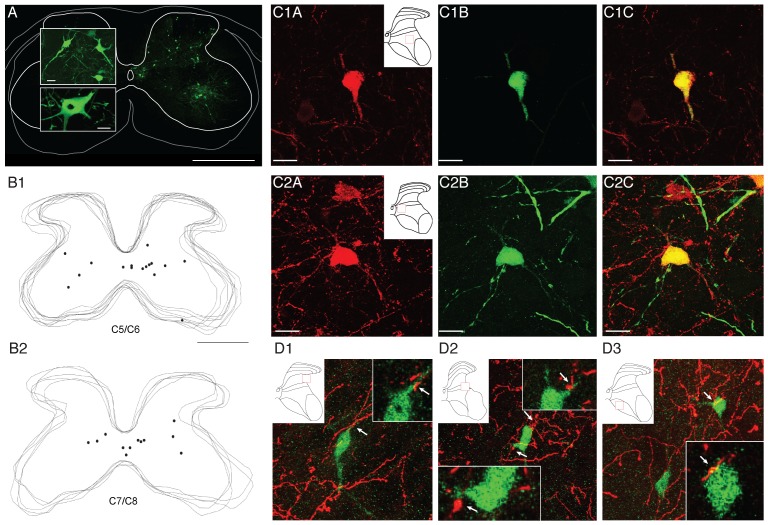
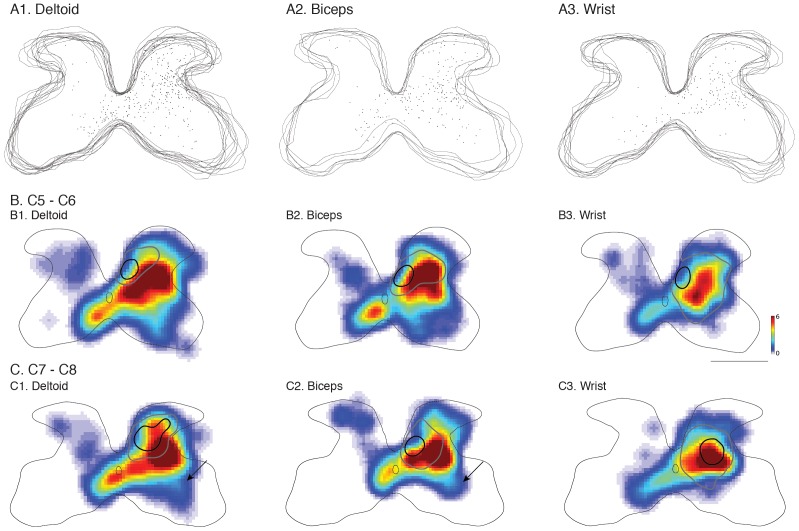
The motor cortex represents muscle and joint control and projects to spinal cord interneurons and-in many primates, including humans-motoneurons, via the corticospinal tract (CST). To examine these spinal CST anatomical mechanisms, we determined if motor cortex sites controlling individual forelimb joints project differentially to distinct cervical spinal cord territories, defined regionally and by the locations of putative last-order interneurons that were transneuronally labeled by intramuscular injection of pseudorabies virus. Motor cortex joint-specific sites were identified using intracortical-microstimulation. CST segmental termination fields from joint-specific sites, determined using anterograde tracers, comprised a high density core of terminations that was consistent between animals and a surrounding lower density projection that was more variable. Core terminations from shoulder, elbow, and wrist control sites overlapped in the medial dorsal horn and intermediate zone at C5/C6 but were separated at C7/C8. Shoulder sites preferentially terminated dorsally, in the dorsal horn; wrist/digit sites, more ventrally in the intermediate zone; and elbow sites, medially in the dorsal horn and intermediate zone. Pseudorabies virus injected in shoulder, elbow, or wrist muscles labeled overlapping populations of predominantly muscle-specific putative premotor interneurons, at a survival time for disynaptic transfer from muscle. At C5/C6, CST core projections from all joint zones were located medial to regions of densely labeled last-order interneurons, irrespective of injected muscle. At C7/C8 wrist CST core projections overlapped the densest interneuron territory, which was located in the lateral intermediate zone. In contrast, elbow CST core projections were located medial to the densest interneuron territories, and shoulder CST core projections were located dorsally and only partially overlapped the densest interneuron territory. Our findings show a surprising fractionation of CST terminations in the caudal cervical enlargement that may be organized to engage different spinal premotor circuits for distal and proximal joint control.


Conflict of interest statement

Competing Interests: The authors have declared that no competing interests exist.

Figures

Figure 1
Figure 1. Methods used for generating color-coded density heat maps.
To illustrate the method, we show a single spinal cord section and, from left to right, the process of resizing the image to a standardized size (A to B), thresholding and skeletonization of the image with ImageJ (C to D) and converting to a color-coded heat map with Matlab (E). Color scale represents the number of pixels per square mm.
Figure 2
Figure 2. Joint-based organization of the forelimb region of the mouse motor cortex.
Frequency distribution plots (A–E) show response topography. Axes show distances from bregma of the motor cortex area mapped. Medial-lateral (M–L) and anterior-posterior distances mapped were up to 1.9 and 2.1 mm respectively from bregma, which corresponds to most of the forelimb representation. Circle diameter for responses is directly proportional to response frequency across animals (10 responses maximum). (F) Representation maps were overlaid to determine any joint-bias within the cortical representation in the composite map. (G) The frequency plots were converted to an overall probability map based on the relative frequency of a dominant response at a specific site in relation to all responses at that site. Map shows the locations of dominant hind limb (H, grey), shoulder (S, green), elbow (E, red) and wrist (W, blue) responses. Shade intensity is directly proportional to the probability of provoking a response for a particular joint. (H) Representative EMG data from contralateral forelimb muscles in response to: threshold cortical stimulation for evoking an elbow response (21 µA, top traces); threshold cortical stimulation for evoking a wrist response (36 mA suprathreshold cortical stimulation for evoking both elbow and shoulder responses (41µA, bottom traces). Vertical and horizontal scales are 0.5 V and 20 ms respectively.
Figure 3
Figure 3. CST termination patterns from joint-specific motor cortex sites.
Anterograde tracer injections were made into joint-specific sites in the motor cortex (A4; color code indicated in inset). Injection sites are shown overlaid on the joint probability map from Fig. 2G. Lightly shaded blue and green circles for wrist and shoulder respectively indicate injection sites where the dominant response and termination pattern were of the same group, yet was accompanied by a second smaller joint response at threshold. A1–3. Micrographs (inverted fluorescence images) of single sections showing CST labeling produced from injected (A1) shoulder, (A2) elbow, and (A3) wrist sites. B. Distribution of CST labeling at C5/C6. Average heatmaps for motor cortex shoulder elbow, and wrist sites (B1–B3). Black contours indicate the boundary of the high-density labeled region (≥60%) based on the averaged heatmap. Gray contours show high-density labeled region from each individual animal. B4 shows overlap of high-density (filled shapes) and low-density (10%; open shapes). Shading and line color according to the inset. C. Same as B, but for C7/C8. Color scale represents number of pixels per mm2. Scale bar = 500 µm.
Figure 4
Figure 4. Density of CST anterograde label at 4 dorsoventral levels.
A. C5/C6. B. C7/C8. Each row plots average label for ROI (inset, A2) from medial to lateral. Inset. Scale bars: 500 µm; 2.5 density units.
Figure 5
Figure 5. Dorsoventral changes in CST labeling.
A. C5/C6. B. C7/C8. Left column plots mean ±SE of average label within each ROI (see inset), for each motor cortex joint zone. Bars plot values for laminae 3–4, laminae 4–5, lamina 6, and laminae 7–9. Horizontal lines at the bottom of each set of bar graphs indicate significant differences on post-hoc analysis (Scheffe test). Stacked percentage bar graphs in right column plot CST contributions from each motor cortex joint zone to the different dorsoventral laminar regions examined.
Figure 6
Figure 6. Cholera toxin b (CTb) labeling in the spinal cord after intramuscular injections and CST-interneuron topographic relationship.
(A1–3) Examples of labeling with CTb subunit in one 40 µm section at level C7/C8, achieved after injection into either deltoids, biceps and the wrist extensor compartments. Matlab-generated heat maps of CTb-labeled spinal gray matter were produced from all sections for each muscle group at levels C5/C6 (B) and at levels C7/C8 (C). Heat maps show transganglionic labeling of the proprioceptive afferents in the dorsal and intermediate region of spinal cord (afferent; i.e. laminae 2–6) and retrograde labeling of the motoneurons in the ventral regions of the spinal cord grey matter (motor pools; i.e. laminae 9). Spinal overlap of motor cortex CST joint zones and proprioceptive afferent terminations are also shown in B and C. As in Figure 3, CST termination contours were set at 60% threshold (black contour) and 10% threshold (gray contour). The color bar demonstrates density of labeling as pixels per mm2 for proprioceptive afferents (left axis) and cells per mm2 for motor pools (right axis). Scale bar is 500 µm.
Figure 7
Figure 7. Spinal labeling of last-order (premotor) interneurons with PRV, co-labeling with ChAT, and contacts with CSTs.
(A) Example of labeling in one 40 µm section achieved at 64 hours after intramuscular PRV injection. Large panel shows labeling on ipsilateral side (Calibration: 500 µm). There was minimal contralateral labeling. Top inset shows an example of labeled interneurons (located in lamina 4 on the section shown), and lower panel, a motoneuron, at higher magnification (Calibration: 25 µm). (B1–B2) Overlaid section images for two representative animals processed in Neurolucida showing positions of individual last-order interneurons from PRV injected into the deltoids, biceps and wrist extensors at levels C5/C6 (B1) and C7/C8 (B2) that also label positively for ChAT. (C1–C2) Confocal images of two representative PRV-ChAT double-labeled interneurons at levels C7/C8 (C1) and C5/C6 (C2). ChAT = red; PRV = green. (D1–3) (D) Confocal images of PRV-labeled interneurons receiving contacts from BDA-labeled CST axons terminals. PRV was injected into the biceps and wrist extensor compartments. Each panel shows a projection image (center, large image) and representative 1 µm optical slices (insets). Arrows show sites of contact,. Scale bars for A, large panel = 500 µm, smaller panels = 50 µm; B, same as A; C and D = 20 µm.
Figure 8
Figure 8. Segmental locations of last-order interneurons after PRV injections into individual muscle groups and CST-interneuron topographic relationship.
(A1–A3) Overlaid C7–C8 section images processed in Neurolucida showing positions of individual last-order interneurons from PRV injected into the deltoids, biceps and the wrist extensor compartments in representative animals. B1–B3. Density heat map produced from all labeled sections at cervical levels C5–C6. C1–C3. Density heat map produced from all labeled sections at cervical levels C7–C8. Overlaid onto heat maps are shoulder, elbow and wrist high-density (black) and low-density (gray) CST termination contours. Color scale represents cells per mm2. Size bar = 500 µm.

References

    1. Porter R, Lemon R (1993) Corticospinal function and voluntary movement. Oxford: Oxford Science. 428 p.
    1. Asanuma H, Arnold A, Zarzecki P (1976) Further study on the excitation of pyramidal tract cells by intracortical microstimulation. Exp Brain Res 26: 443–461. - PubMed
    1. Graziano MS, Taylor CS, Moore T (2002) Complex movements evoked by microstimulation of precentral cortex. Neuron 34: 841–851. - PubMed
    1. Churchland MM, Shenoy KV (2007) Temporal complexity and heterogeneity of single-neuron activity in premotor and motor cortex. Journal of neurophysiology 97: 4235–4257. - PubMed
    1. Kuypers HGJM (1981) Anatomy of the descending pathways. In: Brookhart JM, Mountcastle VB, editors. Handbook of Physiology, Neurophysiology, Vol II. Bethesda,MD: Am. Physiol.Soc. 597–666.

Publication types

MeSH terms